

| Journal of Hematology, ISSN 1927-1212 print, 1927-1220 online, Open Access |
| Article copyright, the authors; Journal compilation copyright, J Hematol and Elmer Press Inc |
| Journal website https://www.thejh.org |
Original Article
Volume 11, Number 3, June 2022, pages 92-108

Hematological, Biochemical Properties, and Clinical Correlates of Hemoglobin S Variant Disorder: A New Insight Into Sickle Cell Trait
Safaa A.A. Khaleda, g ![]() , Heba A. Ahmedb, Mahmoud I. Elbadryc, Eman NasrEldind, Sahar M. Hassanye, Shimaa A. Ahmedf
, Heba A. Ahmedb, Mahmoud I. Elbadryc, Eman NasrEldind, Sahar M. Hassanye, Shimaa A. Ahmedf
aDepartment of Internal Medicine, Clinical Hematology Unit, Assiut University Hospital/Unit of Bone Marrow Transplantation, South Egypt Cancer Institute, Faculty of Medicine, Assiut University, Assiut, Egypt
bDepartment of Clinical Pathology, Faculty of Medicine, Sohag University, Sohag, Egypt
cDepartment of Internal Medicine, Division of Hematology, Faculty of Medicine, Sohag University Hospital, Sohag University, Sohag, Egypt
dDepartment of Clinical Pathology, Faculty of Medicine, Assiut University, Assiut, Egypt
eDepartment of Tropical Medicine and Gastroenterology, Faculty of Medicine, Assiut University, Assiut, Egypt
fDepartment of Internal Medicine, Clinical Hematology Unit, Faculty of Medicine, South Valley University, Egypt
gCorresponding Author: Safaa A.A. Khaled, Department of Internal Medicine, Clinical Hematology Unit, Assiut University Hospital/Unit of Bone Marrow Transplantation, South Egypt Cancer Institute, Faculty of Medicine, Assiut University, Assiut, Egypt
Manuscript submitted January 22, 2022, accepted April 5, 2022, published online June 27, 2022
Short title: A New Insight Into SCT
doi: https://doi.org/10.14740/jh977
| Abstract | ▴Top |
Background: The sickle cell trait (SCT) disorder possesses a clinical heterogeneity ranging from a symptomless condition to sudden death. This study aimed to develop a diagnostic approach that helps the characterization and identification of SCT from normal subjects and sickle cell disease (SCD) patients, and to assess its severity.
Methods: Sixty controls, 24 SCD patients and 31 SCT subjects were assessed clinically, radiologically and by laboratory investigations.
Results: Of the SCT subjects, 12.8% were symptomatic (3.2% anemic, 6.4% hemolytic crisis, and 3.2% painful crises). Anemia was normocytic in 66.6%, and normochromic and polychromatic in 33.4%. Significantly lower red blood cells (RBCs), hemoglobin (Hb), mean corpuscular volume (MCV), mean corpuscular hemoglobin (MCH), hematocrit (Hct), Shine and Lal index (SL), and hemoglobin A (Hb A), and higher mean corpuscular hemoglobin concentration (MCHC), red cell distribution width (RDW), Ricerca index (RI), and Huber-Herklotz index (HH) were found in SCT subjects compared with the controls. Hb A and hemoglobin S (Hb S) were excellent in discriminating SCT from SCD (cut-off for SCT > 50% and < 40%) followed by Hct, MCHC, Hb, Green and King index (GK), and England and Fraser index (EF) (cut-off for SCT > 33%, > 32, > 11, < 71, and < 10, respectively). Radiologically normal findings were detected in 87% of SCT subjects; they had nearly normal liver and renal function tests (except one case each). A schematic diagnostic paradigm for SCT was proposed.
Conclusion: This study allowed understanding of SCT in various aspects, i.e., clinical, hematological, biochemical and radiological. Thus, it could help prevention of the Hb S variant disorder and proper management of carriers. This might be applied in pre-marital screening, particularly in those with family history of Hb S disorder.
Keywords: Sickle cell trait; Insight; Identification; Clinical correlates; Hemoglobin S
| Introduction | ▴Top |
Normally, human hemoglobin contains three types of hemoglobin, Hb A, A2 and F, each being composed of 2α and 2β, 2δ and 2γ globin chains, respectively. Hb F is the dominant Hb up to 6 weeks postnatal, and then Hb A dominates. The hemoglobin S (Hb S) variant is the end product of a gene defect resulting in a single nucleotide mutation with the end product of a β6-valined globin chain. People harboring this mutation will have Hb S variant disorder, where their red blood cells (RBCs) acquire sickle shape under conditions with low oxygen tension [1, 2]. Inheritance of one normal β gene and one sickle cell gene results in a genotype of AS hemoglobin and the subject will have sickle cell trait (SCT). If the person inherited the two mutated copies of β gene, he/she will have sickle cell disease (SCD) (SS homozygous). The SCT condition was found to resist infection with malaria [3, 4].
The sickle cell (SC) disorder is a type of hemoglobinopathy that is more prevalent in Equatorial Africa, India and the Middle East. However, legal and illegal migrations transmitted the disease to the Americas, Indian subcontinent and the Mediterranean basin. The SC disorder possesses a clinical heterogeneity ranging from asymptomatic disease to severe life-threatening one [2]. This was partly explained by the percentage of different types of hemoglobin among patients. The clinical course of the Senegal and Saudi Asian haplotypes was found mild; this was further explained by the higher percentage of Hb F in those patients which inhibits Hb S polymerization [5, 6]. Numerous studies documented that polymerization of Hb S molecule is the cornerstone in pathogenesis of the disease and its complications in subjects with the Hb S variant disorder. Consequently, the higher the erythrocyte Hb S content, the more severe the clinical picture [7].
Subjects with SCT may be completely asymptomatic and their complete blood counts (CBCs) may be apparently normal. However, they pass the disease to their children in a co-dominant pattern of inheritance with a 50% chance to have children with SCT and 25% chances to have normal or SCD child (if two parents are SCT). Accordingly, identification of SCT and its differentiation from SCD is of paramount importance for carrier management and disease prevention. Moreover, we assume that the routine inclusion of SCT in pre-marital screening, together with proper counseling of couples, could have a great impact in primary prevention of the Hb S variant disorder. Our assumption was applied in some countries in the Middle Eastern region, as in Saudi Arabia, where pre-marital Hb S screening became a nationwide program to avoid abortions that are prohibited by religious values [8]. In addition, detection of SCT in asymptomatic athletes may prevent incidence of serious complications and/or sudden death as a result of strenuous exercise. Exceptionally, some subjects with SCT may present with severe complications or pain crisis as in those with SCD [9-11].
Screening tools for Hb S variant include CBC, blood smears and sickling test. However, definitive diagnosis of SCT requires techniques for hemoglobin separation and genetic studies. Those are expensive laboratory investigations that are available in specialized centers and require highly skilled personnel. The approach to screen subjects with relatively cheap, available and simple laboratory tests, and then to further investigate those highly suspicious to have SCT with expensive confirmatory tests seems more practical approach [12, 13]. A group of new red cell indices were proved effective in differentiating β-thalassemia from iron deficiency anemia. Those could be obtained by simple mathematical calculations of RBCs parameters in the automated CBC [14]. To the best of our knowledge, data about the value of these red cell indices in subjects with SCT are little.
In Egypt, the Hb S disorder is not uncommon; however, it is more prevalent in certain regions of the country as Siwa Oasis, and El-Wadi Al-Jadid (New Valley) Governorate. Moez and Younan screened school children at Siwa Oasis by hemoglobin electrophoresis. Hb S variant disorder constituted 20% of those with hemoglobinopathies in their study, of which SCT represented 94%. Epidemiological studies about the prevalence of Hb S in other regions of the country are scarce [15].
Many researchers do not consider SCT a disease; moreover, it is not known why some persons developed complications and others not [2, 11]. All these findings motivated us to perform the current study, aiming to revise characterization and disease identification of SCT, and also, to propose a diagnostic paradigm for SCT that relies on simple, available diagnostic techniques. The final aim was to explore the association of the new CBC parameters and percent of Hb type with disease severity in SCT subjects.
| Materials and Methods | ▴Top |
Study subjects and settings
SCD patients were recruited among those admitted to/attending the Hematology Units and Clinics at Internal Medicine Departments and private sections at Sohag, Assiut and Qena University Hospitals (SUH, AUH and QUH) during the period from August 2018 to August 2021. SCT subjects were recruited by screening family members of SCD patients. Another 60 unrelated healthy volunteers (control group) were recruited via poster advertisement at the same centers. They were among blood donors, medical students, and medical and paramedical professionals, if their ages range from 18 to 55 years, and had no confirmed hematological illnesses. Study participants were categorized into group 1: subjects with Hb S variant that was subdivided into group 1a: SCD patients and group 1b: SCT subjects, and group 2: the healthy control group.
Patients’ exclusion criteria were: 1) patients with chronic infections or inflammations, i.e., those unrelated to the disease state as co-incidence of inflammatory arthritis; 2) patients who had blood transfusion over the past 3 months; 3) patients diagnosed with SCD combined with other hemoglobinopathies; and 4) patients with regular hydroxycarbamide (HU) therapy.
The study was conducted in accordance with the Declaration of Helsinki, and approved by the Institutional Review Board (or Ethics Committee) of Faculty of Medicine, Sohag University (protocol code Soh-Med-18-07-3 and date of approval July 2018).
Tools of data collection
Medical history and clinical examination
Both patients and controls were subjected to medical history and physical examination. Those were conducted by the specialist clinician (author) either at the outpatient clinic or in the ward. All participants were interviewed to assess eligibility for the study and collect demographic and clinical characteristics. The later included disease history, presenting complaints, number of painful crises, and incidence of serious complications. Next patients were physically examined looking for evidence of pallor, jaundice, leg ulcers, splenomegaly or autosplenectomy. Their therapeutic history denoted only 40% of SCD patients were in HU therapy; nearly 75% of them were non-compliant, and only those who had stopped HU for 10-days or more were included in the study. The remaining were on supportive and on demand therapeutic regimens. Unfortunately, due to a lack of availability or coverage by health insurance, the three new FDA-approved medications for SCD (L-glutamine, voxelotor, and crizanlizumab) were not available in our centers. All the study procedures and sampling were done before patients started their in-hospital treatment.
Laboratory investigations
1) CBC
Peripheral blood samples were withdrawn for routine and diagnostic laboratory investigations. Two milliliters blood were collected on potassium ethylenediaminetetraacetic acid (EDTA) anticoagulant coated tube for CBC using an automated cell counter (Cell-Dyn 3700; Abbott Diagnostic, Dallas, USA). The normal CBC adult reference ranges were adopted (according to manufacturer’s instructions) as follows: white blood cells (WBCs, 4 - 11 × 103/µL); RBCs (males 4.5 - 6 × 10⁶/µL, females 3.8 - 4.8 × 10⁶/µL); hemoglobin (males 13 - 17 g/dL, females 12 - 16 g/dL); hematocrit (Hct, males 39-51%, females 36-48%); mean corpuscular volume (MCV, 76 - 96 fL); mean corpuscular hemoglobin (MCH, 26 - 32 pg); mean corpuscular hemoglobin concentration (MCHC, 32 - 37 g/dL); red cell distribution width (RDW, 12-15%), platelets (150 - 450 × 103/µL); reticulocytes (0.5-2.5%). MCV and MCHC were used as indicators of red cell size and chromicity, respectively.
2) Sickle solubility test
Currently, the most common screening techniques in patients with sick cell anemia (SCA), at our centers, include sickle solubility testing as first screening test, then high-performance liquid chromatography (HPLC), for discrimination and relative quantification of Hb S allowing for differentiation of SCD from SCT syndromes [5]. Solubility test was carried out with the use of sodium metabisulfite as reducing agent, when exposed to sodium metabisulfite, Hb S from lysed erythrocytes precipitates, causing the solution to become turbid. The interpretation is based on visual inspection of the test tube, and positive result suggests the diagnosis of SCA but the test could not differentiate SCD from SCT [13].
3) HPLC
Quantitative assessment of hemoglobin variants (to detect different types of hemoglobins; Hb F, A, A2 and S) was performed by HPLC on D-10 instrument (Bio-Rad Laboratories, USA). The different Hb variants were identified by using retention time windows which were specific for these variants. The normal reference ranges for these variants were 96-98.5% for Hb A, 1.5-3.2% for Hb A2, 0-0.8% for Hb F, and 0% for Hb S. Patient was diagnosed as SCT if his RBC contained approximately 30-40% Hb S and 60-70% Hb A [9, 12].
Isoelectric focusing (IEF) and cytogenetic analyses for Hb S variant were not performed as they are not available at our centers at the time of the study.
4) Liver function tests (LFTs) and renal function tests
LFTs were performed for all subjects on a modular P auto-analyzer (Roche Diagnostics, Mannheim, Germany).
Calculation of the targeted red cell indices
We followed others and calculated the targeted red cell indices from the automated CBC for all the study participants with the following equations [14]:
Mentzer index (or MI) = MCV/RBC [16];
RDW index (RDWI) = MCV × RDW/RBC [17];
Green and King index (GK) = MCV × MCV × RDW/(Hb × 100) [18];
Ehsani index (EI) = MCV - 10 × RBC [19];
England and Fraser index (EF) = MCV - (5 × Hb) - RBC - 3.4 [20];
Ricerca index (RI) = RDW/RBC [21];
Srivastava index (SI) = MCH/RBC [22];
Shine and Lal index (SL) = MCV × MCV × MCH/100 [23];
Huber-Herklotz index (HH) = MCH × RDW × 0.1/RBC + RDW [24];
Sirdah index (Sir I) = MCV - RBC - (3 × Hb) [25].
Next sensitivity (Sens), specificity (Spec), positive predictive value (PPV) and negative predictive value (NPV) and Youden’s index (YI) were calculated for each parameter as follows:
Sens = true positive/(true positive + false negative);
Spec = true negative/(true negative + false positive);
PPV = true positive/(true positive + false positive);
NPV = true negative/(true negative + false negative);
The percentage of correctly identified patients was: (true positive + true negative)/(true positive + true negative + false positive + false negative);
YI = (Sens + Spec) - 1.
Radiologic assessment (abdominal ultrasound)
All SCD patients and SCT subjects were asked to fast at least 6 h, then scanned by abdominal ultrasound (US) in supine position to obtain optimal views of the liver, gallbladder (GB), kidneys and spleen. Both right and left oblique positions were used as alternate positions if organs were not clearly visualized in supine position.
The liver span was measured in the right lobe with the longitudinal center of the right kidney in the plane of imaging. Liver parenchyma echotexture and focal abnormalities were assessed. Hepatomegaly was defined if the long axis of the liver is > 150 mm. The wall thickness and content of GB were also assessed.
Long axis of the spleen was measured at the level of the hilum: if it is > 130 mm, it was defined as splenomegaly, and shrunken if < 50 mm. The spleen was assessed also for parenchymal echotexture and focal abnormalities.
The length of the kidneys was obtained by measuring the bipolar length (long axis) of the kidneys. The upper limits for normal right and left kidneys sizes were 128 and 130 mm, respectively. The kidneys were considered abnormally echogenic if the renal cortex was equal to or more echogenic than adjacent spleen or liver. Kidneys were also assessed for the presence of renal calculi, cysts, or other focal parenchymal abnormalities [26].
Statistical analyses
Statistical analyses were performed by SPSS 18.0 and 20 softwares (SPSS, Inc., Chicago, IL). Quantitative data were represented as mean ± standard deviation (SD) and the Pearson’s χ2 test or Fisher’s exact test was used to compare differences of dichotomous variables. The normality of the variables was checked using the Shapiro-Wilk test. Accordingly, nonparametric tests (Mann-Whitney U-test) were used to compare means between the two independent groups when the dependent variable is either continuous, but not normally distributed. Multiple comparisons tests were used to control the error rate. Receiver operating characteristic (ROC) curve was used to determine an optimum cut-off point for each studied RBC index or Hb type, to discriminate between patients and controls and between SCD and SCT. Correlations were assessed by the Spearman rank correlation coefficient. Statistical significance was assumed at a P value < 0.05. Figures were created using the GraphPad Prism software package, version 5.02 (San Diego, CA).
| Results | ▴Top |
Basic demographic and laboratory characteristics of SCD patients, SCT subjects (group 1) and the controls (group 2)
Table 1 shows no statistically significant differences among groups 1 and 2 in gender, age and residence. Males predominated in Hb S variant cases (56.4% vs. 43.6%) and the male to female ratios were 1.3:1, 1.4:1, and 1.2 for groups 1, 1a and 1b, respectively. CBC parameters (RBCs, Hb, MCV, MCH, and Hct) and Hb fractions (A) were significantly lower in group 1, while reticulocyte counts, Hb F and Hb S were significantly higher, compared with group 2 (P < 0.001). Notably, there were no significant differences in MCHC between cases and controls (36.21 ± 10.61 and 32.59 ± 1.26, respectively). Similar results were obtained when comparing SCT subjects with the controls, except MCHC which was significantly higher in SCT subjects as shown in Table 2.
 Click to view | Table 1. Demographic, Clinical and Hematological Characteristics of Studied Groups |
Click to view | Table 2. T-Test Results of Hematological Parameters of SCT Subjects and Control Group |
Significantly higher RDW, RDWI, SL, RI, and HH results were found in patients compared with the controls (P < 0.001), and group 1 patients had higher MI and SI values than group 2 (P = 0.04 and 0.02, respectively). When considering SCT subjects, the RDW, RI and HH were significantly higher, while SL was significantly lower, when compared with the controls. Table 3 shows the differences of Hb fractions of SCT subjects compared with the controls. As expected, the sickle solubility test was positive in the study of Hb S variant in cases and negative in the controls.
Click to view | Table 3. Differences of Hemoglobin Fractions Between SCT Subjects and Control Group |
Comparison between SCD (group 1a) and SCT (group 1b) patients
There was male predominance in groups 1a and 1b patients (58.35% and 54.8%, respectively). SCT patients were mostly accidentally discovered (80.6% vs. 0%) and had significantly lower hemolytic crisis, characterized by sudden fall in Hb and concomitant rise of reticulocytes (6.4% vs. 37.5%) and painful crisis (3.2% vs. 33.3%) than those with SCD. They also had significantly higher age (median age 29 years vs. 22 years), Hb levels, MCHC, Hct, Hb A and A2, and lower reticulocyte counts, Hb F and Hb S than SCD patients. No significant differences in RBCs, MCV and MCH were noted between groups 1a and 1b. SCT patients had significantly lower HH, GK, EF, SI, RI, Sir I, RDW, and RDWI results than those with SCD. These results are described in Table 1.
Characteristics of anemia in SCT and SCD patients
SCT subjects had significantly normal Hb values (g/dL) (60% vs. 13%) and RDW values (57% vs. 25%) than those with SCD (Fig. 1a, b). However, there were no significant differences between SCD patients and SCT subjects as regards MCV (normocytic 70% vs. 55%, microcytic 30% vs. 45%) and RBCs (Fig. 1c, d). According to chromicity, SCT subjects had significantly normochromic results compared to those with SCD patients (40% vs. 16.7%) (Fig. 1e). Hypochromia was noted in only 20% of SCT patients and 83.3% of SCD patients. An astonishing finding was the high MCHC in 40% of SCT patients.
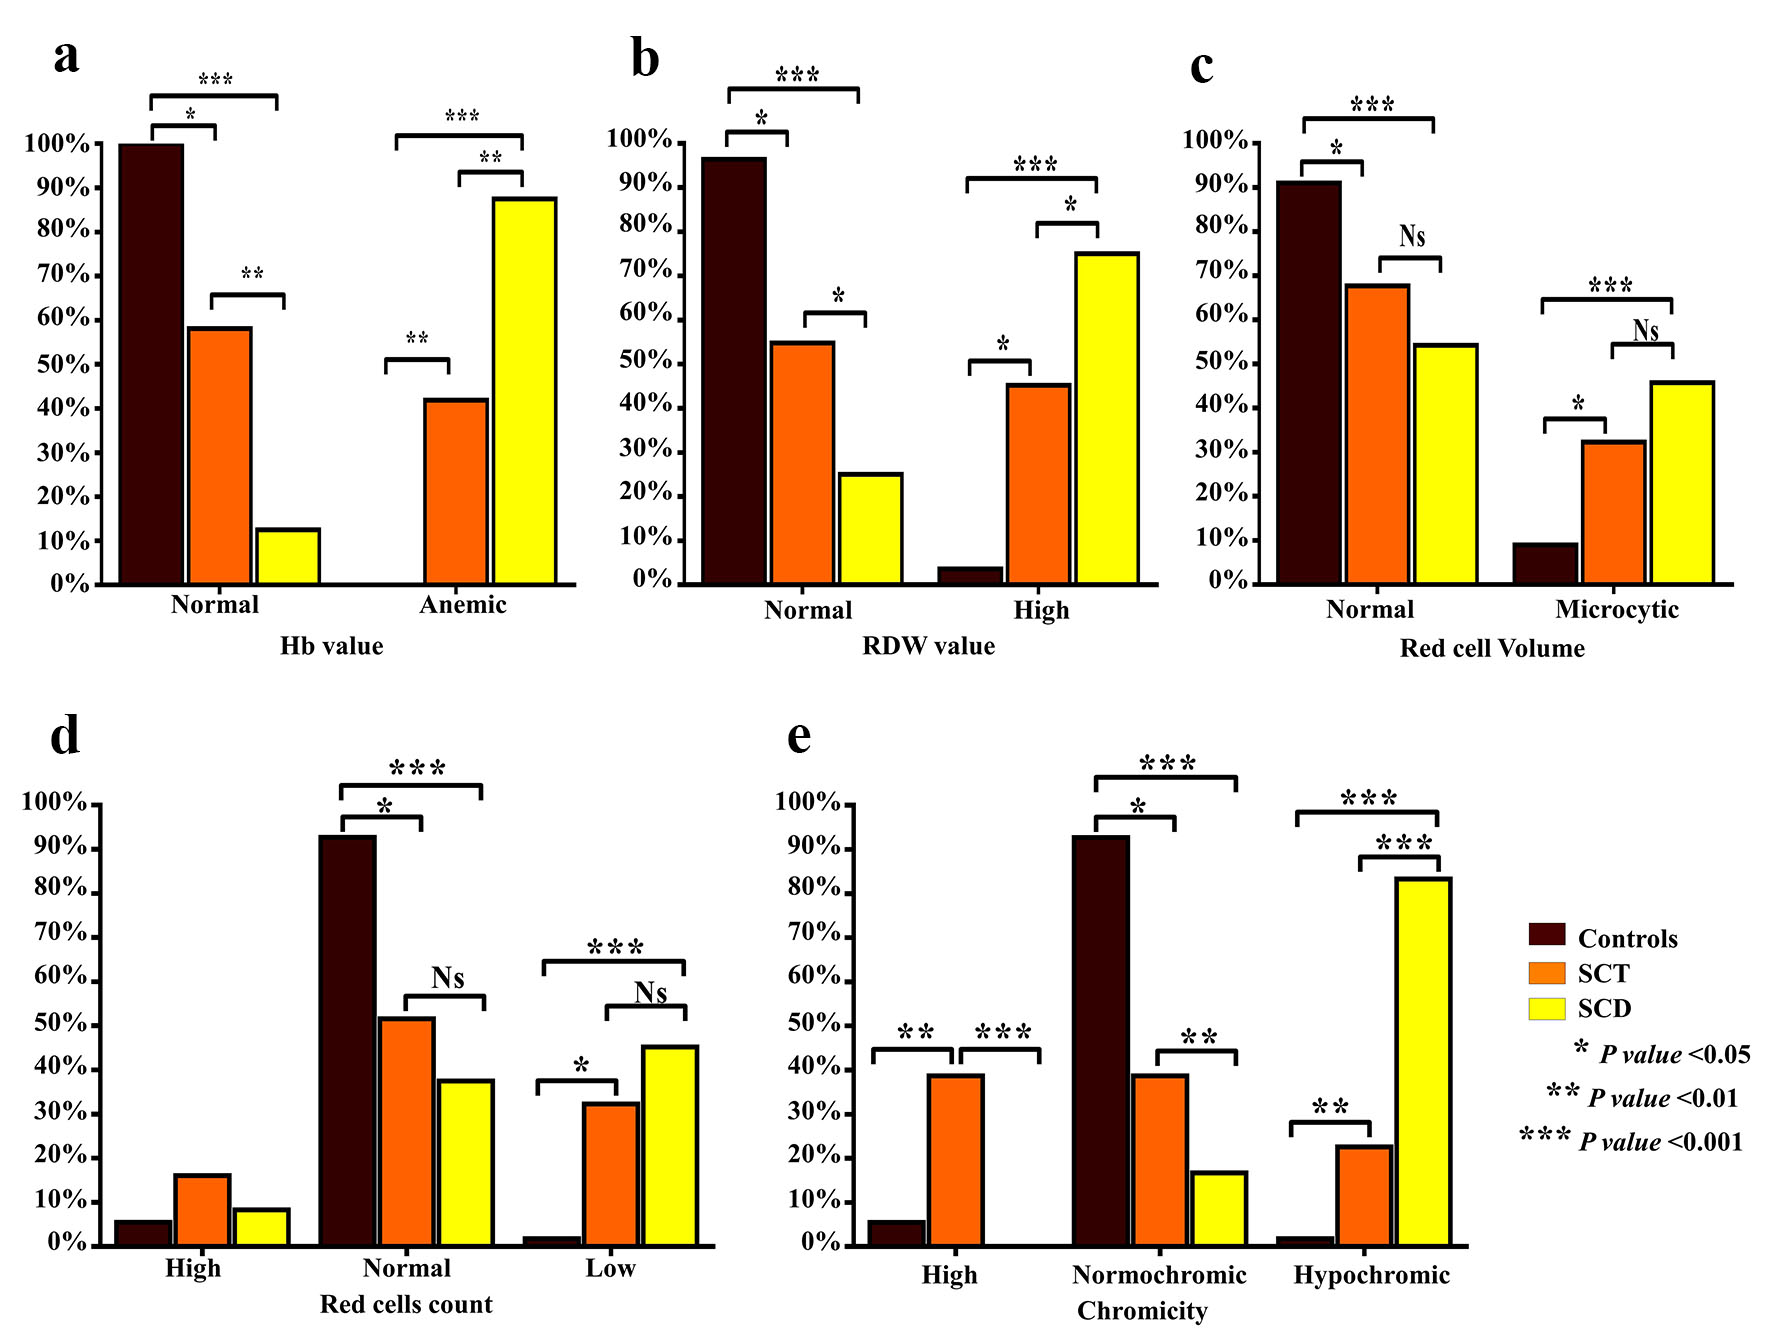 Click for large image | Figure 1. Comparison of characteristics of anemia between SCT subjects and SCD patients. Bar graphs show the percentages of Hb values (g/dL) (a), RDW value (b), the RBC count (× 106/L) (c), RBC volume (MCV, fL) (d) and chromicity (MCHC, g/dL) (e). SCT: sickle cell trait; SCD: sickle cell disease; Hb: hemoglobin; RDW: red cell distribution width; RBC: red blood cell; MCV: mean corpuscular volume; MCHC: mean corpuscular hemoglobin concentration. |
Validation of the targeted red cell indices and Hb type in discriminating Hb S variant cases (group 1) from the controls (group 2) and the SCT subjects (group 1b) from SCD patients (group1 a)
Figure 2 and Supplementary Material 1 (www.thejh.org) show the ROC curve analysis results and predictive values of the evaluated indices for the differential diagnosis of group 1 (Hb S variant cases) and the controls (group 2). According to the sensitivity, specificity, positive and negative predictive values, % of correctly identified patients, and YI analyses, the best measures for discriminating Hb S variant cases from healthy controls were RDW, RDWI, SL, RI, and HH. The identified cut-off values for group 1 cases were > 14, 241, 1,700, 2.8, and 215, respectively, and P values were < 0.001. MI, GK and SI were less significant in differentiating patients from the controls.
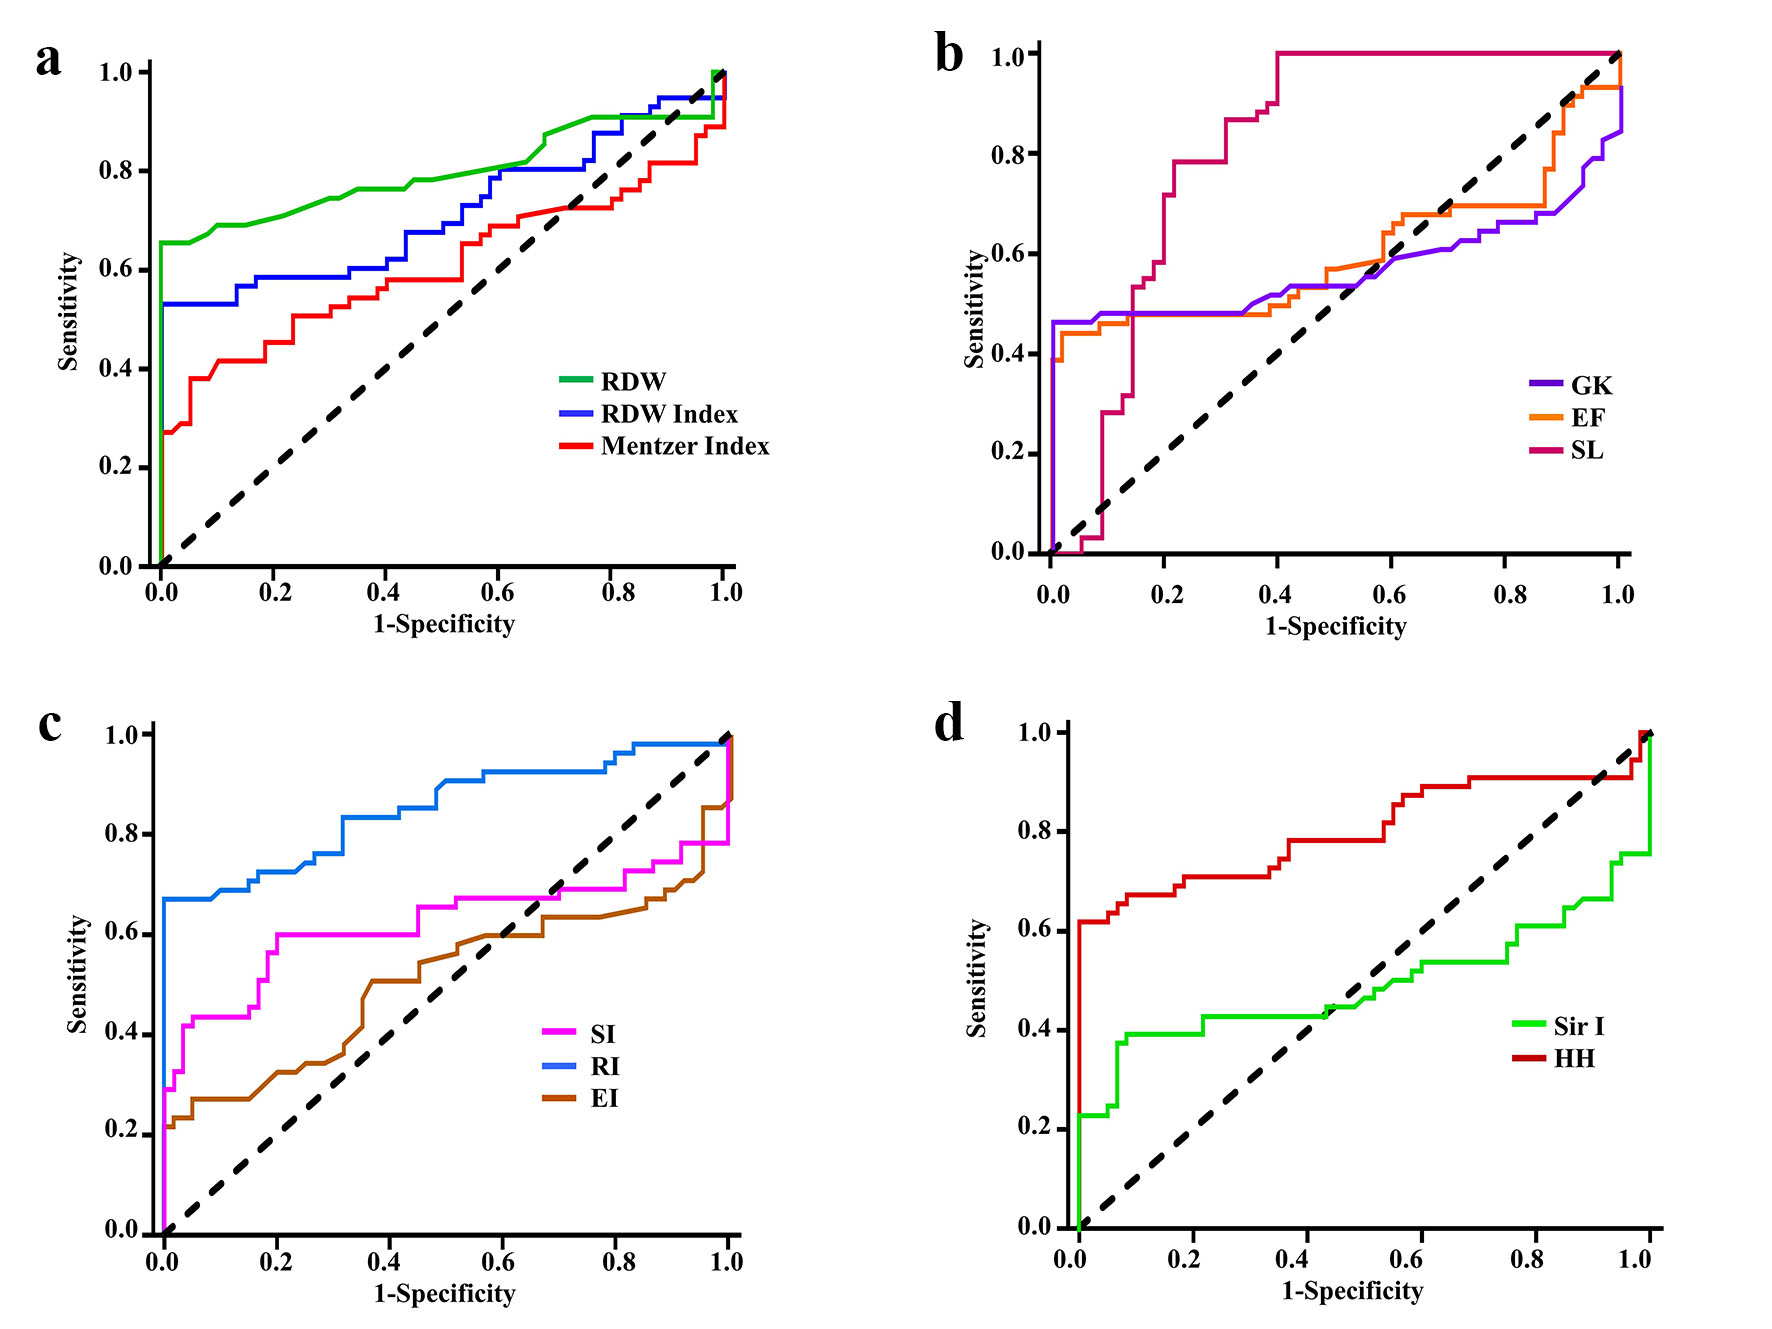 Click for large image | Figure 2. Receiver operating characteristic curves for discriminating cases with Hb S variant (group 1) from healthy controls by: (a) RDW, RDWI and Mentzer index, (b) GK, EF and SLI, (c) SI, RI and EI, and (d) Sir I and HH. Hb: hemoglobin; RDW: red cell distribution width; RDWI: red cell distribution width index; GK: Green and King index; EF: England and Frazer index; SL: Shine and Lal index; SI: Srivastava index; RI: Ricerca index; EI: Ehsani index; Sir I: Sirdah index; HH: Huber-Herklotz index. |
Table 4 shows the ROC curve analysis results and predictive values of the evaluated indices for the differential diagnosis of SCT subjects (group 1b) from the controls (group 2). Still RDW, SL, RI, and HH, the best parameters to differentiate the two groups, showed similar cut-off values as above.
Click to view | Table 4. Receiver Operating Characteristic Curve Analysis Results and Predictive Values of Evaluated Indices for Differential Diagnosis of SCT Subjects and Control Group |
Figure 3 and Supplementary Material 2 (www.thejh.org) show the ROC curve analysis results and predictive values of the evaluated indices for the differential diagnosis of SCT subjects (group 1b) and SCD patients (groups 1a). Both revealed significant differences for all parameters (P < 0.05) except for RBCs and MI. Hb levels, MCHC, Hb F, RDW and RDWI were considered good to discriminate between SCD and SCT. Hct, Hb A and Hb S were considered excellent for discriminating SCD from SCT cases: the area under the ROC curve was 0.82, 0.98, and 0.98 (all P < 0.001), and 95% confidence interval (CI) values were 0.69 - 0.94), 0.94 - 1.09, and 0.94 - 1.02, respectively. According to the sensitivity, specificity, positive and negative predictive values, % of correctly identified patients, and YI analyses, the cut-off values of Hb A and Hb S in SCT cases were > 50% and < 38%, respectively.
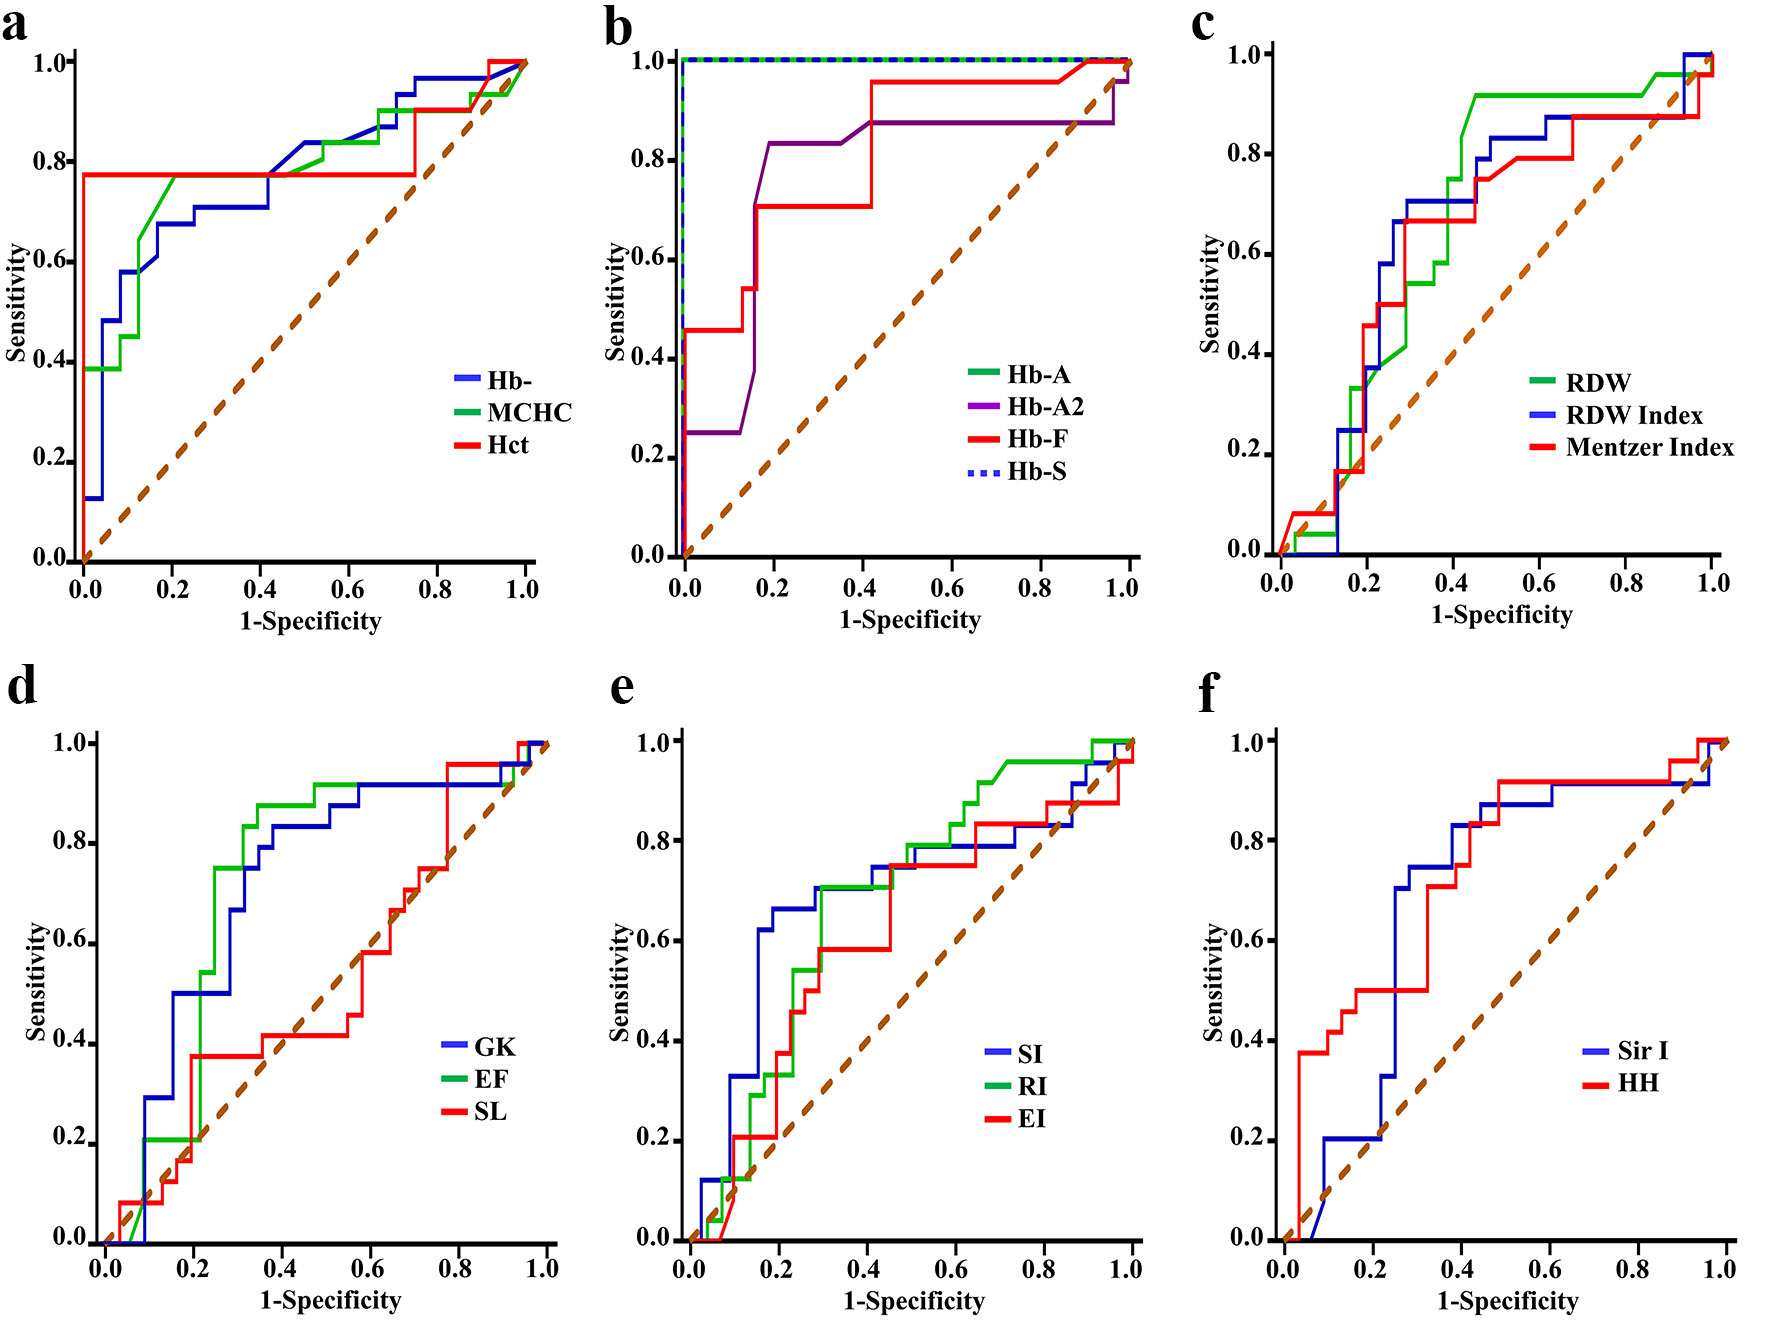 Click for large image | Figure 3. Receiver operating characteristic curves for discriminating patients with SCD from subjects with SCT by: (a) Hb, MCHC and Hct, (b) Hb A, Hb A2, Hb F and Hb S, (c) RDW, RDWI and Mentzer index, (d) GK, EF and SL, (e) SI, RI and EI, and (f) Sir I and HH. SCT: sickle cell trait; SCD: sickle cell disease; Hb: hemoglobin; MCHC: mean corpuscular hemoglobin concentration; Hct: hematocrit; RDW: red cell distribution width; RDWI: red cell distribution width index; GK: Green and King index; EF: England and Frazer index; SL: Shine and Lal index; SI: Srivastava index; RI: Ricerca index; EI: Ehsani index; Sir I: Sirdah index; HH: Huber-Herklotz index. |
An interesting finding is that there was no effect of gender on all the above mentioned red cell indices starting from MI up to Sir I whether in patients or controls.
Association of the evaluated red cell indices and percent of Hb type with disease severity
There were apparently significant negative correlations between RDWI, MI, GK, RDW, RI, SI, EF, SL, EI, Sir I, and HH with Hb levels (as an indicator of disease severity), and significant positive correlations between the same indices with Hb F and Hb S except for MI, SI, EI, and Sir I that were correlated with Hb F only; SL was not correlated with any Hb subtype. On the other hand, the RDW only slowed significant positive correlation with reticulocyte %, and these results are illustrated in Figure 4, I-III.
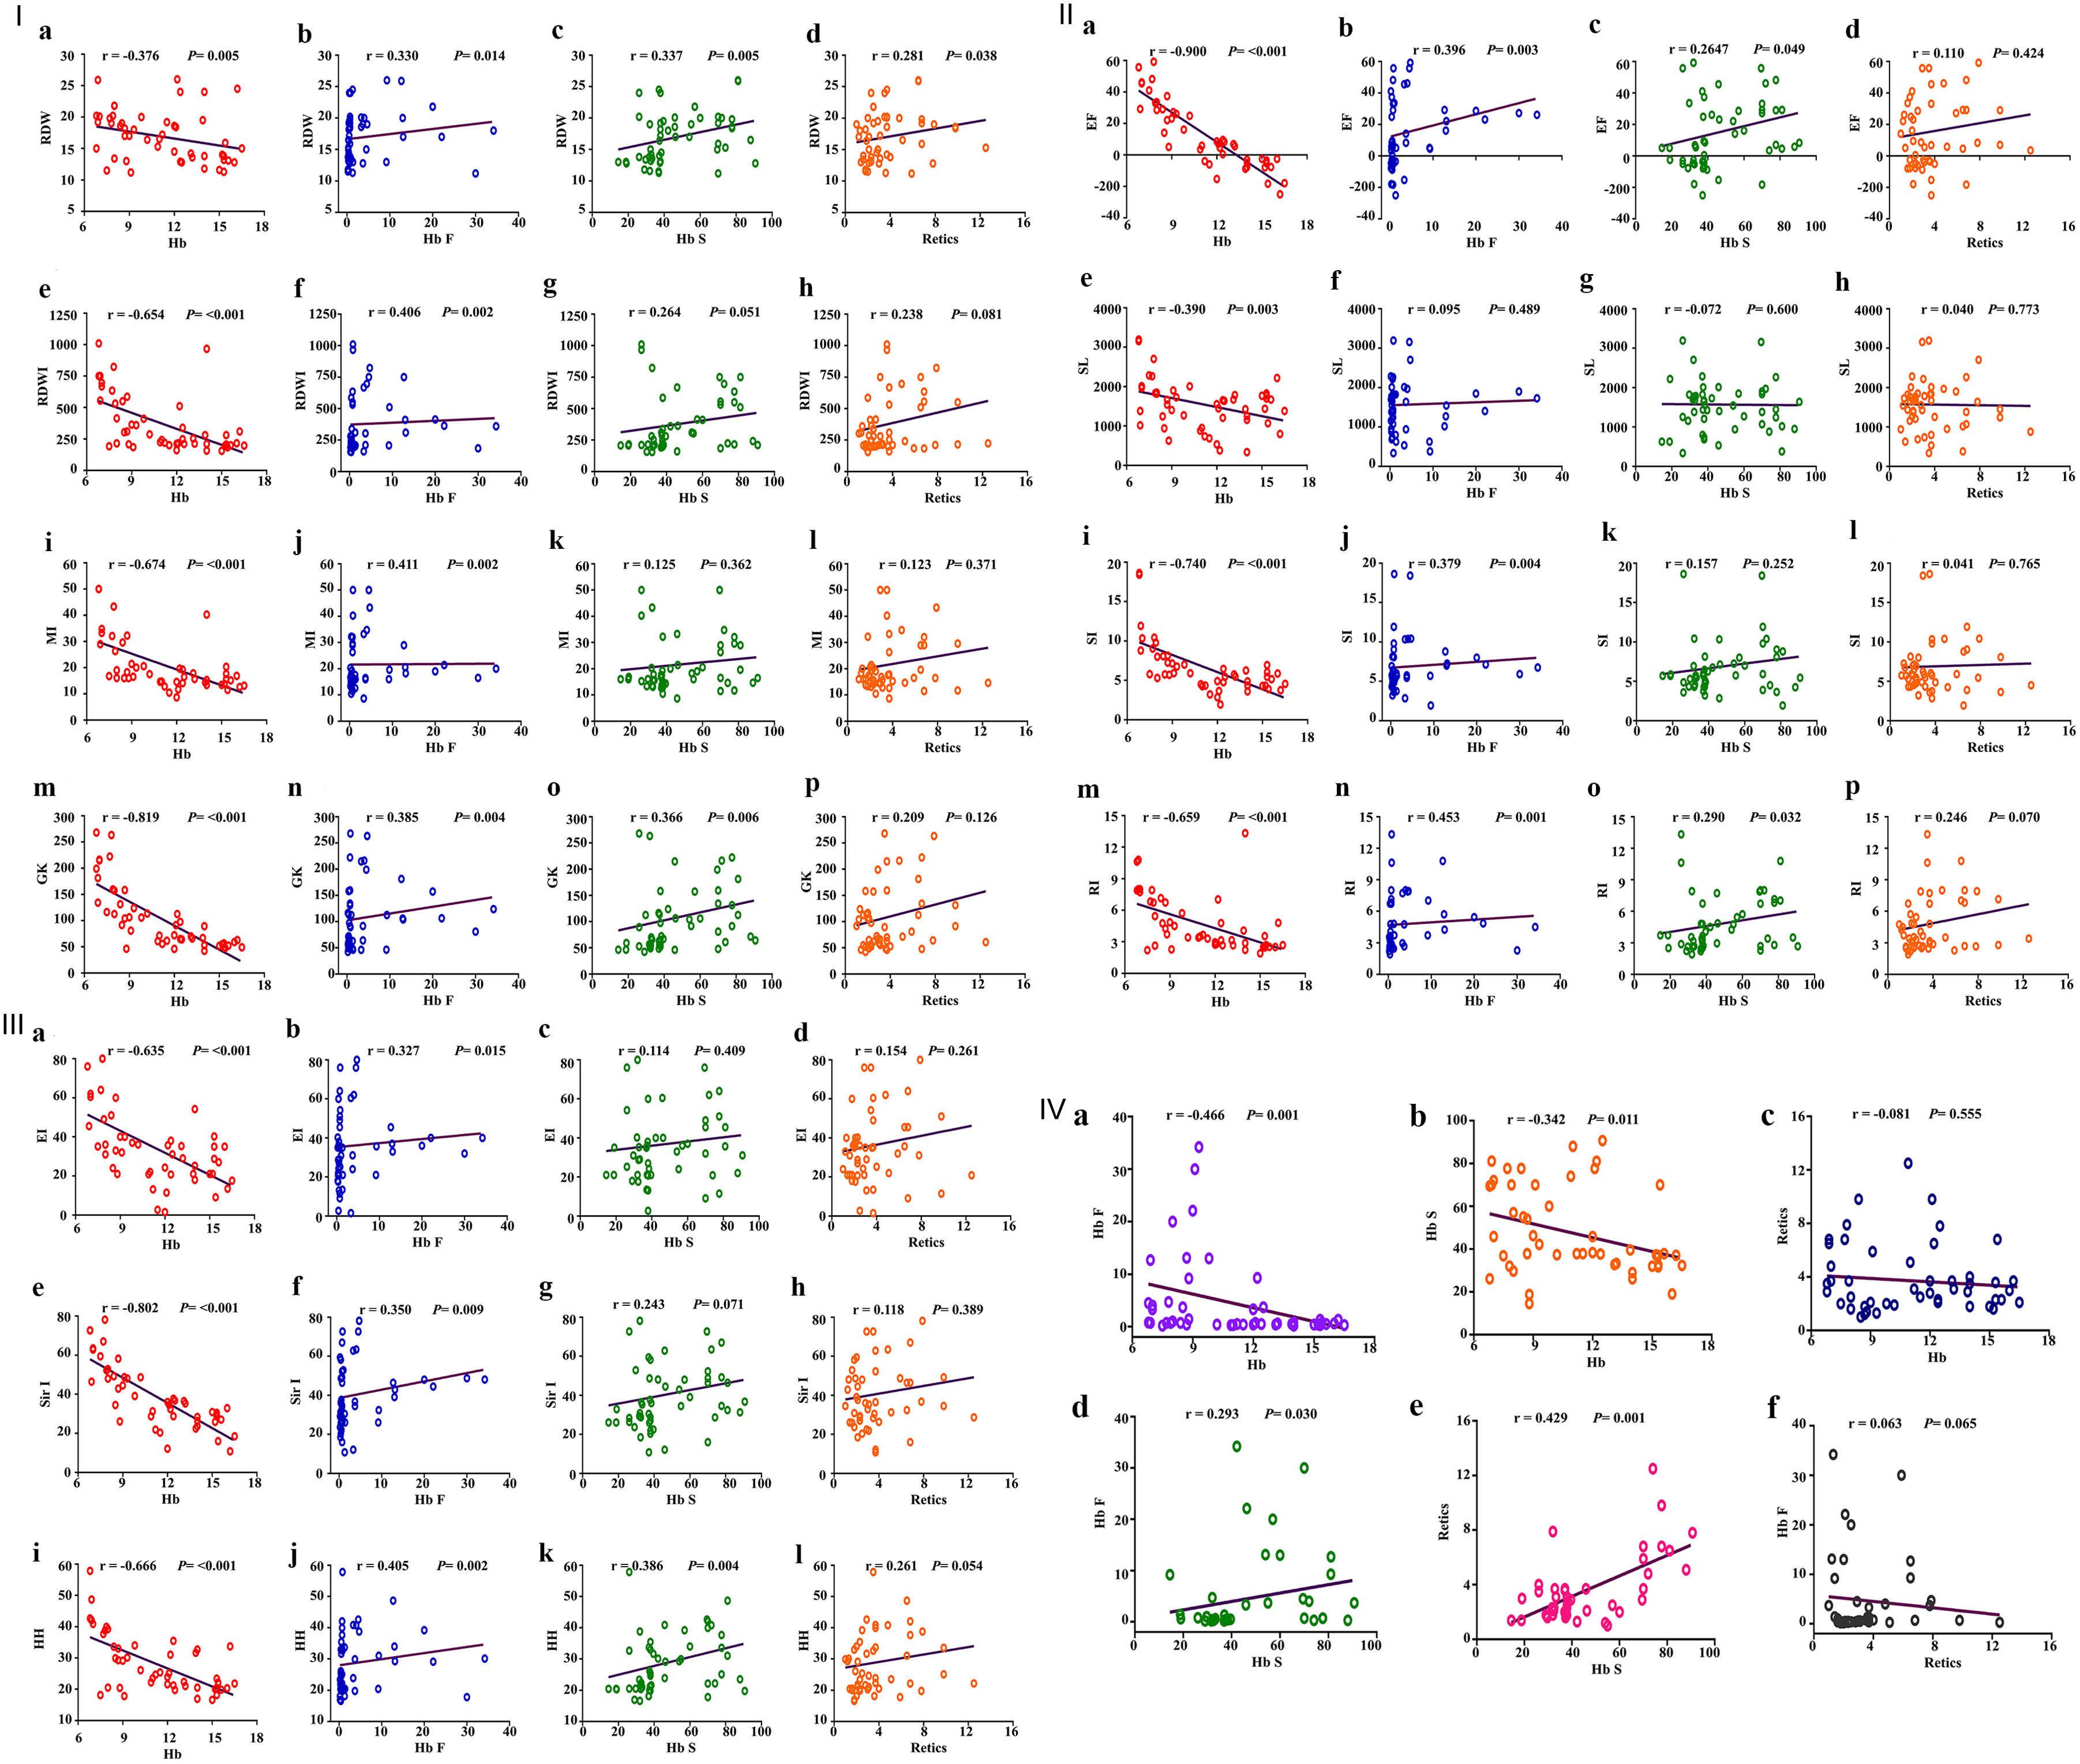 Click for large image | Figure 4. I: Schematic box plots representing the correlations of RDW, RDWI, MI and GKI results with hematological parameters among hemoglobin S variant cases. First, correlation between RDW and (a) Hb levels, (b) Hb F, (c) Hb S, (d) reticulocyte count; second, correlation between RDWI and (e) Hb levels, (f) Hb F, (g) Hb S, (h) reticulocyte count; third, correlation between Mentzer index and (i) Hb levels, (j) Hb F, (k) Hb S, (l) reticulocyte count; fourth, correlation between GK and (m) Hb levels, (n) Hb F, (o) Hb S, (p) reticulocyte count. II: Schematic box plots representing the correlations of (a-d) EF, (e-h) SL, (i-l) SI and (m-p) RI results with hematological parameters among hemoglobin S variant cases. Correlated as indicated in the figure. III: Schematic box plots representing the correlations of (a-d) EI, (e-h) Sir I and (i-l) HH results with hematological parameters among hemoglobin S variant cases. Correlated as indicated in the figure. IV: Schematic box plots representing correlations of some hematological parameters (a-f) among hemoglobin S variant cases. RDW: red blood cell distribution width; RDWI: red blood cell distribution width index; MI: Mentzer index; GKI: Green and King index; EF: England and Frazer index; SL: Shine and Lal index; SI: Srivastava index; RI: Ricerca index; EI: Ehsani index; Sir I: Sirdah index; HH: Huber-Herklotz index. r: Spearman rank correlation coefficient; P: P value. |
As expected, there were significant negative correlations between Hb level (g/dL) and Hb-F and Hb S, and significant positive correlations between Hb F and Hb S and Hb S and reticulocyte count; strikingly no correlations were detected between reticulocyte count and Hb levels or Hb F (Fig. 4, IV).
Radiological and biochemical characteristics of the Hb S variant cases (SCD patients and SCT subjects)
Figure 5 illustrates the radiological findings of SCD and SCT cases of the study, and 87% of SCT subjects were radiologically normal. Their biochemical profile showed nearly normal LFT and kidney function test (KFT) except one case each.
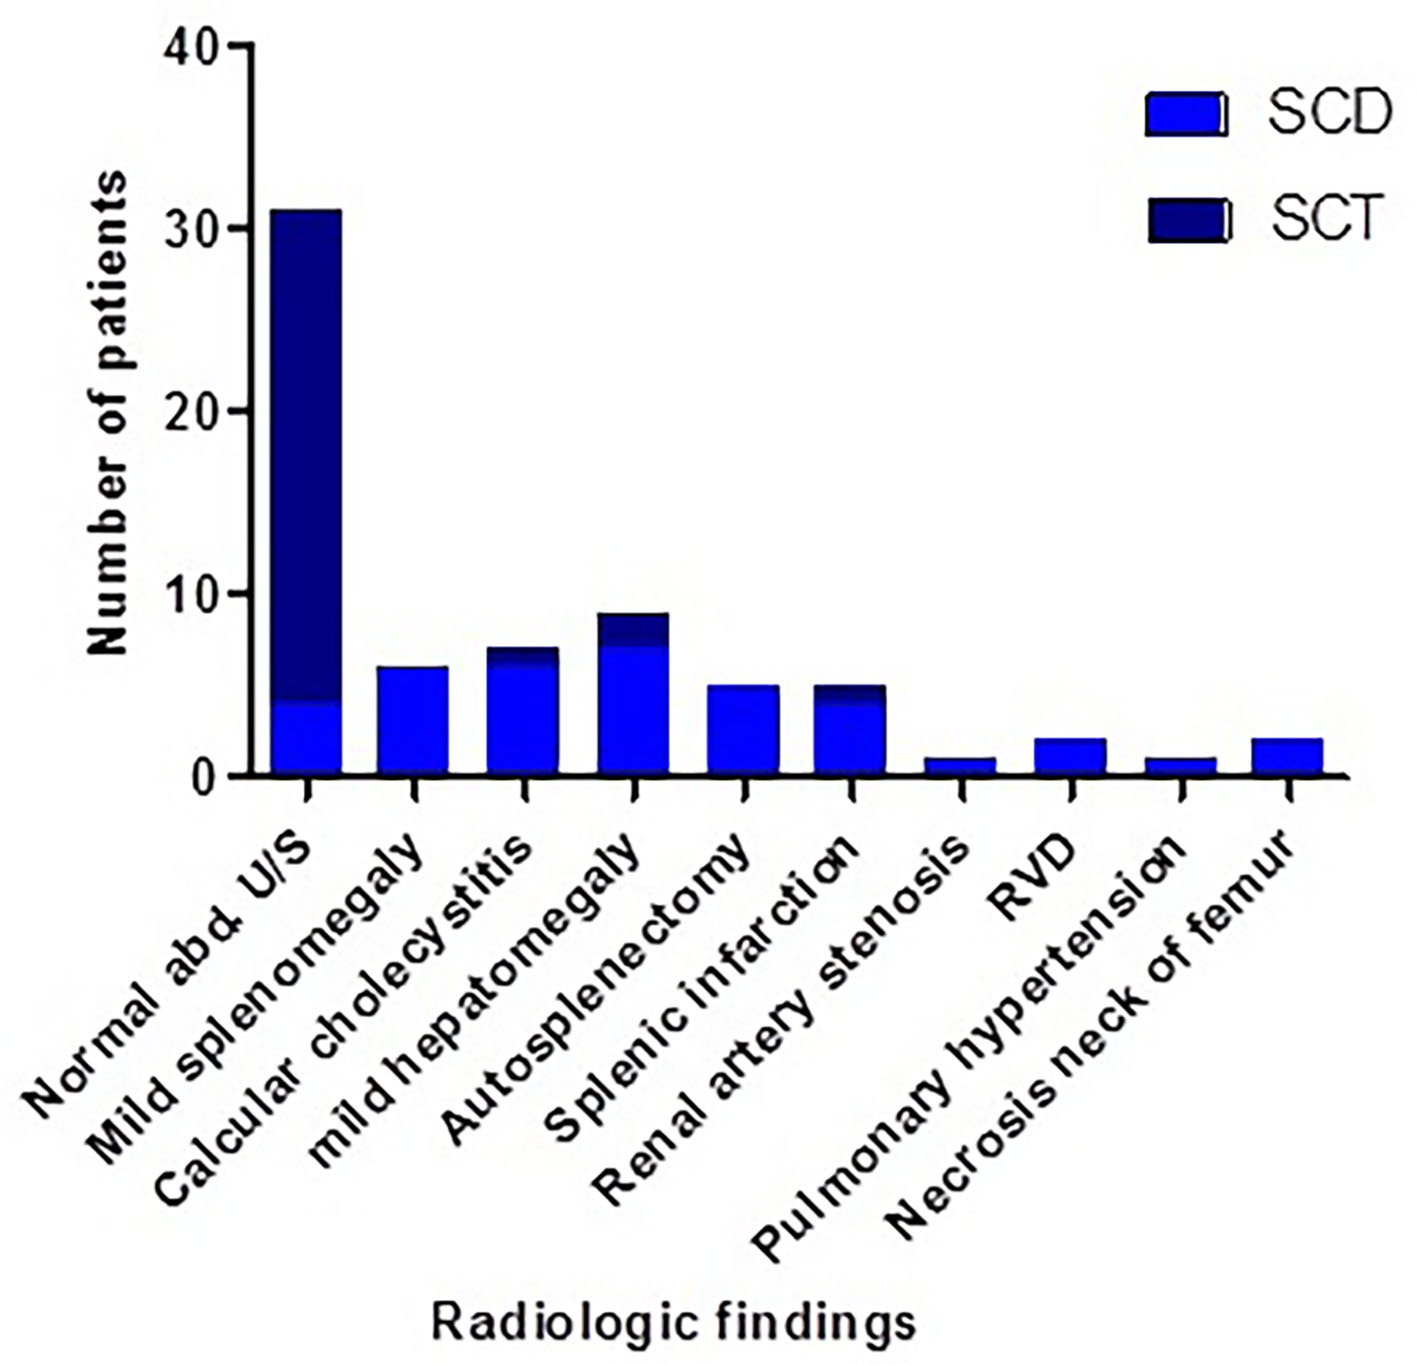 Click for large image | Figure 5. Radiological findings of SCD and SCT cases of the study. SCT: sickle cell trait; SCD: sickle cell disease. |
Proposed diagnostic paradigm for identification of SCD patients and SCT subjects
Figure 6 illustrates a proposed diagnostic paradigm that could help the identification of SCD patients and SCT subjects.
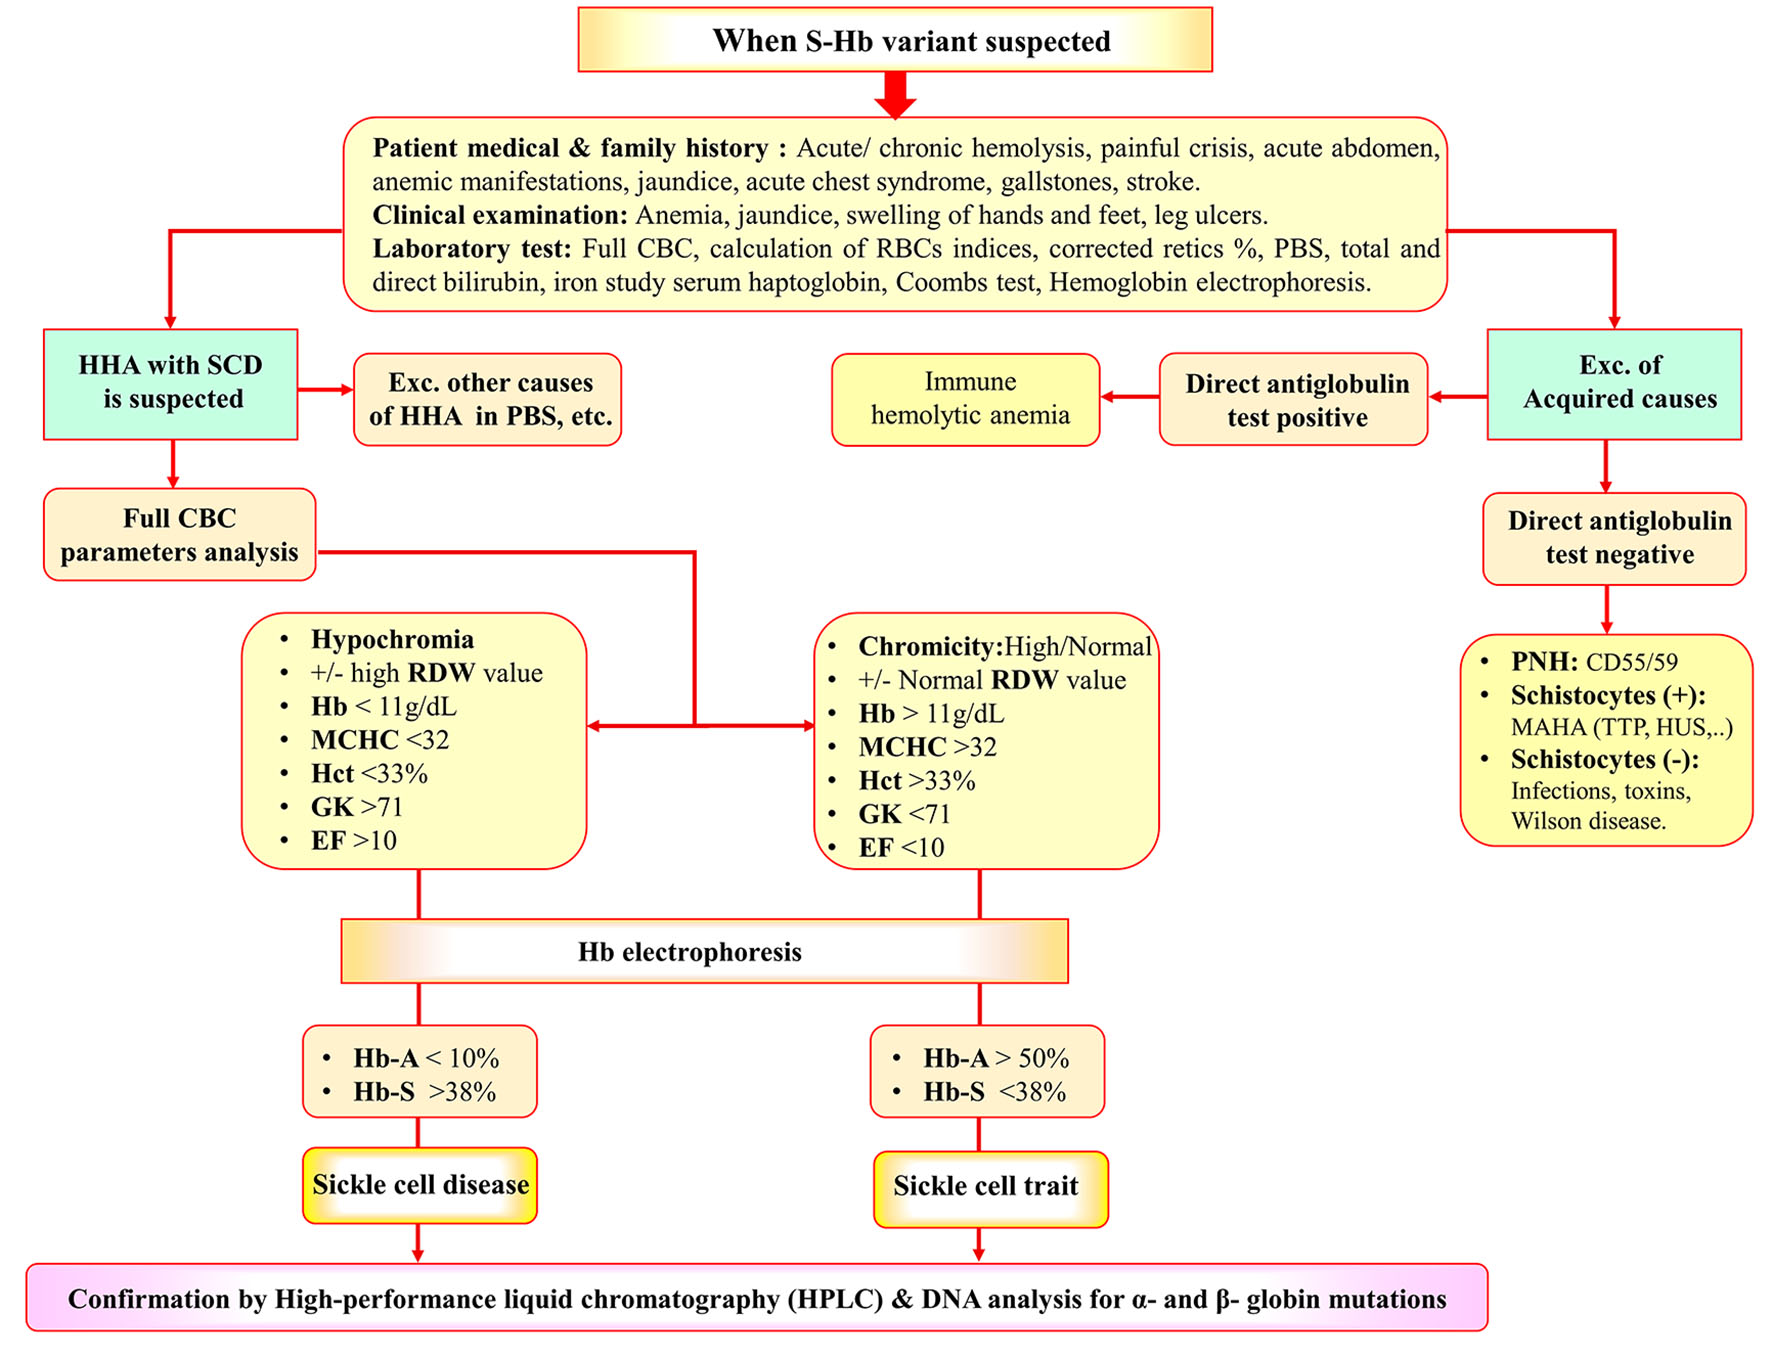 Click for large image | Figure 6. Diagnostic algorithm for identification of SCD and SCT. SCT: sickle cell trait; SCD: sickle cell disease; HHA: hereditary hemolytic anemia; CBC: complete blood cell count; PBS: peripheral blood smear; AIHA: autoimmune hemolytic anemia; MAHA: microangiopathic hemolytic anemia; TTP: thrombotic thrombocytopenic purpura; HUS: hemolytic uremic syndrome; PNH: paroxysmal nocturnal hemoglobinuria. |
| Discussion | ▴Top |
SCT is an inherited blood disorder that is commonly symptomless, with little or no change in blood counts. However, parents pass the disease to their children; moreover, some subjects develop severe complications and sudden death, and the latter is more common among soldiers and athletes. Neonatal screening for SCA is not implemented in many countries worldwide [14]. This study was conducted to create a stepwise approach that could help hematologists and physicians to identify SCT subjects from healthy persons and from SCD patients. This approach is based on interrogation of both clinical, laboratory and radiological characteristics. To do so, three groups of subjects (controls, SCD, and SCT) were enrolled in the study, who were subjected to clinical, laboratory, and radiological assessments. Laboratory tests included CBC, sickle solubility, HPLC, biochemical analysis of bilirubin, liver enzymes, serum creatinine and blood urea nitrogen. Radiological assessment was done with abdominal US, and other radiological tests such as echocardiography were done according to the clinical presentation of each patient.
The homozygous form of Hb S, SCD, leads to vessel occlusion, blood stasis and chronic activation of the coagulation system responsible for vaso-occlusive crises and venous thromboembolism (VTE) which may be fatal. Although many SCD complications have not been linked to SCT, there are several physiological pathways that could increase the incidence of these adverse outcomes in SCT subjects [11]. This study reported some of these complications in SCT patients as hemolytic crises and painful crises but with markedly lower rate than among those with SCD. Nevertheless, severe complications as acute chest syndrome, acute abdomen, obstructive jaundice and aplastic crisis were noticed in SCD patients only. The main symptomatology of SCT subjects was with manifestations of anemia. Only, nearly 80% of SCT patients were asymptomatic. These results were less than those reported by Moez and Younan, where 50% of their SCT subjects were symptomatic [15]. Moreover, the results were contradictory to many researchers and hematology textbooks which consider SCT not a form of SCD or, not a disease itself, and that SCT subjects are clinically and hematologically normal. These discrepancies could be related to the haplotype or the Hb S fraction in each subject as a reciprocal relationship between Hb S and clinical picture was reported [27, 28].
Nearly 40% of SCT subjects of this study were not hematologically normal, and they have lower RBCs, Hb, MCV and MCH compared with the controls. In accordance with others, the anemia in both SCD and SCT subjects was mostly normocytic; also, microcytosis was detected in a considerable proportion of our patients [29]. Interestingly, we reported higher MCHC in 40% of SCT subjects compared with SCD and controls, while the MCHC was low in SCD (80%) patients. These findings could be explained by a possible concomitant iron deficiency anemia which is the most common type of anemia in our locality [30-32]. These results were in accordance with Akodu et al who found low MCHC in their SCD patients. They explained their findings by the endemicity of malarial infection in Nigeria. However, they concluded that SCD is a disorder with higher MCV and MCH than controls [33]. Mouele et al explained the macrocytosis in SCD by the chronic hemolysis in those patients with higher number of young RBCs and high MCV [34]. Another explanation for these conflicting results is that, unlike the current study, most of these studies included pediatric patients where the rate of hemolysis is higher compared with adults.
In order to find the best diagnostic index that can separate healthy and Hb S variant disorder subjects, ROC curve analyses for red cell indices were done for the study participants. Cut-off value for each index was variable in various literatures, which also was clearly different between different patient populations. To provide the fairest analysis, we calculated the optimum cut-off values and computed ROC curve for each index. In addition, we applied RBC indices as a simple and cheap method for discriminating between SCD and SCT subjects. In the current study, significantly lower RBCs, Hb, MCV, MCH, and Hct and significantly higher RDW, RDWI, SL, RI, and HH could differentiate Hb S variant subjects from healthy individuals.
Sahli et al recommended EI, MI and SL to discriminate between SCD and SCT [14]. In this study, Sir I and EF had good discriminatory power, as well (YI = 87 and 83, respectively). Moreover, MCV, RBC, and MCH had high sensitivity and specificity in differentiation between SCD and SCT (Se 98%, 92% and 79%, respectively and Sp 92%, 92% and 94%, respectively) with their new cut-off values of 78.7 fL, 3.36 × 10¹²/L and 23.9 pg, respectively. Moreover, SCT subjects had a higher Hct, RDW and RDWI than SCD patients, who have significantly more severe anemia. When considering gender, this study confirmed the findings of others and concluded that gender has no effect on the new RBCs indices (from MI to Sir I) [14].
The discrimination between the SCD and SCT relies in addition to hematological parameters and Hb electrophoresis on HPLC and DNA studies which are not available in all laboratories and expensive [35]. HPLC results of this study showed significantly higher Hb F in SCD patients compared with SCT and control subjects, also Hb F was higher in SCT than controls. This may have resulted from the use of medications, e.g., HU, hereditary persistence of Hb F or a characteristic of the haplotype [36].
In this study, ROC curve analyses of CBC parameters and Hb fractions revealed that the best tests to discriminate SCD patients and SCT subjects were Hb A and Hb S, and both remained powerful with an extreme increase in their YI values (0.97). The cut-off values to be considered for SCT were > 50% and < 38%, respectively, followed by Hct, MCHC, Hb level, GK and EF (cut-off values for SCT > 33%, > 32 g/dL, > 11 g/dL, < 71, and < 10, respectively).
In accordance with others, this study proved that Hb S % is the main determinant of disease severity in SC disorder cases [26]. Moreover, the study reported association of higher values of RDWI, MI, GK, RDW, RI, SI, EF, SL, EI, Sir I, and HH with low Hb (g/dL) levels accordingly denoting more severe disease. Interestingly, the study concluded no significant association between reticulocyte percent and Hb levels. This could be explained that CBC parameters in this study were collected after improvement of hemolytic or painful crisis.
Little is found in literature about radiological findings of SCT subjects. In this study, the Hb S variant cases were screened with abdominal US, and other radiological assessments such as skeletal radiology and echocardiography were done according to clinical presentation. Some of radiological findings of SCD patients were reported in SCT subjects as mild hepatomegaly, calcular cholecystitis, and splenic infarction. These results were albeit consistent with Naik and his colleague who reported incidence of nephropathy, and higher risk of venous or arterial thromboembolism in SCT subjects [9]. On the other hand, the current study reported incidence of dilated right side of the heart, pulmonary hypertension, autosplenectomy and necrosis of the neck of femur SCD patients only [37].
Neonatal screening helps to determine the early signs of the Hb S variant disorder and reduces morbidity and mortality by early comprehensive care and prophylactic treatment [38]. Neonatal screening is not available in many countries [39]. Moreover, intrauterine screening seems impractical in countries where traditions and religious values prohibit abortion. Moreover, SCT may be the leading cause of exercise-related morbidity and sudden death, particularly under extreme conditions. This assumption was supported by the work of Nelson and Anzalone and their co-workers [40, 41]. This motivated us to develop a diagnostic algorithm of Hb S variant disorders, mainly SCD and SCT. It includes the differentiation between hereditary and acquired causes of other hemolytic anemias, which can present with similar symptoms and signs. Firstly, a careful medical history of the patient and his family should be obtained. Hematological parameters, red cell indices, microscopic blood smear examination and the direct antiglobulin test (DAT) are essential for diagnosis, particularly in many hereditary and acquired forms. Measurement of Hb fractions is important to distinguish SCT from SCD. Although, the distinction is not always evident and needs more investigation as HPLC followed by family and DNA studies.
Conclusions and future work
This study concluded that SCT should not be considered a harmless condition. It provided a full scenario of SCT for hematologists and physicians and created a simplified approach for SCT. As mass screening for SCT seems of little benefit, our approach helps easy identification of SCT in daily practice; this could be followed by counseling for couples. This study provokes the use of simplified discriminatory indices between SCD and SCT, allowing 100% of correctly diagnosing patients. These indices can be used as a very good screening method provided that the cut-off values are correctly identified for the studied population.
Now a perplexed inquiry could be why this study reported clinical, radiographical and hematological abnormalities in the study SCT subjects? A possible answer would be the severity of the haplotype in the study locality (Benin haplotype) [15]. Other explanation could be related to the environmental and social circumstances of those cases where some of them were living in Oasis and rural areas with higher temperature and rocky hills, which in turn expose subjects to dehydration and hypo-oxygenation. Furthermore, in those areas, people usually incorporated in tedious jobs as mining and raising animals [11, 42].
It is known that screening tools for SCD include CBC, peripheral blood smear, sickling test, Hb electrophoresis, and HPLC, and genetic studies are confirmatory tests, but they are not available in many centers, and require specialized personnel [43]. This study provided a simple tool for screening for SCD in addition to SCT.
The limitation in our study was none of the proposed indices had both 100% Se and 100% Sp to discriminate SCD from SCT. However, the combination of more than two indices would improve the results performance and raise the YI to 100%.
Based on the findings of this study, we recommended further long-term follow-up studies for cases of SCT to have an accurate understanding of this neglected hematological disorder.
| Supplementary Material | ▴Top |
Suppl 1. Receiver operating characteristic curve analysis results and predictive values of the evaluated indices for the differential diagnosis of hemoglobin S variant cases (sickle cell disorder) and the control group.
Suppl 2. Receiver operating characteristic curve analysis results and predictive values of the evaluated indices for the differential diagnosis of SCD patients and SCT subjects.
Acknowledgments
Great thanks to the HODs of the concerned departments who facilitated project administration and data collection.
Financial Disclosure
This research received no external funding.
Conflict of Interest
The authors declare no conflict of interest.
Informed Consent
Informed consent was obtained from all subjects involved in the study.
Author Contributions
Conceptualization: Khaled SAA; methodology: Khaled SAA and Elbadry MI; software: Khaled SAA and Elbadry MI; validation: Khaled SAA and Elbadry MI; formal analysis: Khaled SAA and Elbadry MI; investigation: Ahmed HA, NasrEldin E, and Hassany SM; resources: Khaled SAA and Elbadry MI; data curation: Khaled SAA, Ahmed HA, and Ahmed SA; writing-original draft preparation: Khaled SAA, Ahmed HA, Elbadry MI, Hassany SM and Ahmed SA; writing-review and editing: Khaled SAA, Ahmed HA, Elbadry MI, Hassany SM, NasrEldin E and Ahmed SA; visualization: Khaled SAA; project administration: Khaled SAA and Elbadry MI. All authors have read and agreed to the published version of the manuscript.
Data Availability
The authors declare that all data supporting the findings of this study are available within the article and the supplementary file.
| References | ▴Top |
- Lichtman MA, Kaushansky K, Prchal JT, Levi MM, Burns LJ, Armitage JO. Williams Manual of Hematology, 9th Edition. 2017.
- Ajayi AA. Should the sickle cell trait be reclassified as a disease state? Eur J Intern Med. 2005;16(6):463.
doi pubmed - Balgir RS. Community expansion and gene geography of sickle cell trait and G6PD deficiency, and natural selection against malaria: experience from tribal land of India. Cardiovasc Hematol Agents Med Chem. 2012;10(1):3-13.
doi pubmed - Allison AC. Genetic control of resistance to human malaria. Curr Opin Immunol. 2009;21(5):499-505.
doi pubmed - Green NS, Fabry ME, Kaptue-Noche L, Nagel RL. Senegal haplotype is associated with higher HbF than Benin and Cameroon haplotypes in African children with sickle cell anemia. Am J Hematol. 1993;44(2):145-146.
doi pubmed - Eichner ER. Sickle cell trait. J Sport Rehabil. 2007;16(3):197-203.
doi pubmed - Eaton WA. Hemoglobin S polymerization and sickle cell disease: A retrospective on the occasion of the 70th anniversary of Pauling's Science paper. Am J Hematol. 2020;95(2):205-211.
doi pubmed - Alhamdan NA, Almazrou YY, Alswaidi FM, Choudhry AJ. Premarital screening for thalassemia and sickle cell disease in Saudi Arabia. Genet Med. 2007;9(6):372-377.
doi pubmed - Naik RP, Haywood C, Jr. Sickle cell trait diagnosis: clinical and social implications. Hematology Am Soc Hematol Educ Program. 2015;2015:160-167.
doi pubmed - Connes P, Reid H, Hardy-Dessources MD, Morrison E, Hue O. Physiological responses of sickle cell trait carriers during exercise. Sports Med. 2008;38(11):931-946.
doi pubmed - Tsaras G, Owusu-Ansah A, Boateng FO, Amoateng-Adjepong Y. Complications associated with sickle cell trait: a brief narrative review. Am J Med. 2009;122(6):507-512.
doi pubmed - Joutovsky A, Hadzi-Nesic J, Nardi MA. HPLC retention time as a diagnostic tool for hemoglobin variants and hemoglobinopathies: a study of 60000 samples in a clinical diagnostic laboratory. Clin Chem. 2004;50(10):1736-1747.
doi pubmed - Tubman VN, Field JJ. Sickle solubility test to screen for sickle cell trait: what's the harm? Hematology Am Soc Hematol Educ Program. 2015;2015:433-435.
doi pubmed - Sahli CA, Bibi A, Ouali F, Fredj SH, Dakhlaoui B, Othmani R, Laouini N, et al. Red cell indices: differentiation between beta-thalassemia trait and iron deficiency anemia and application to sickle-cell disease and sickle-cell thalassemia. Clin Chem Lab Med. 2013;51(11):2115-2124.
doi pubmed - Moez P, Younan DN. High prevalence of haemoglobin S in the closed Egyptian community of Siwa Oasis. J Clin Pathol. 2016;69(7):632-636.
doi pubmed - Mentzer WC Jr. Differentiation of iron deficiency from thalassemia trait. Lancet. 1973;1:882.
doi - Jayabose S, Giavanelli J, Levendoglu-Tugal O, Sandoval C, Ozkaynak F, Visintainer P. Differentiating iron deficiency anemia from thalassemia minor by using an RDW-based index. J Pediatr Hematol. 1999;21:314.
doi - Green R, King R. A new red cell discriminant incorporating volume dispersion for differentiating iron deficiency anemia from thalassemia minor. Blood Cells. 1989;15(3):481-491; discussion 492-485.
- Ehsani MA, Shahgholi E, Rahiminejad MS, Seighali F, Rashidi A. A new index for discrimination between iron deficiency anemia and beta-thalassemia minor: results in 284 patients. Pak J Biol Sci. 2009;12(5):473-475.
doi pubmed - Hamblin TJ. Differentiation of iron deficiency from thalassemia trait by routine blood-count. Lancet. 1973;1(7804):676.
doi - Ricerca BM, Storti S, d'Onofrio G, Mancini S, Vittori M, Campisi S, Mango G, et al. Differentiation of iron deficiency from thalassaemia trait: a new approach. Haematologica. 1987;72(5):409-413.
- Srivastava PC. Differentiation of thalassemia minor from iron deficiency. Lancet. 1973;2:154-155.
doi - Shine I, Lal S. A strategy to detect beta-thalassaemia minor. Lancet. 1977;1(8013):692-694.
doi - Huber AR, Ottiger C, Risch L. Thalassemie-syndrome: klinik und diagnose. Schweiz Med Forum. 2004;4:947-952.
doi - Sirdah M, Tarazi I, Al Najjar E, Al Haddad R. Evaluation of the diagnostic reliability of different RBC indices and formulas in the differentiation of the beta-thalassaemia minor from iron deficiency in Palestinian population. Int J Lab Hematol. 2008;30(4):324-330.
doi pubmed - Afzal S, Masroor I, Beg M. Evaluation of chronic liver disease: does ultrasound scoring criteria help? Int J Chronic Dis. 2013;2013:326231.
doi pubmed - Noubiap JJ, Temgoua MN, Tankeu R, Tochie JN, Wonkam A, Bigna JJ. Sickle cell disease, sickle trait and the risk for venous thromboembolism: a systematic review and meta-analysis. Thromb J. 2018;16:27.
doi pubmed - Xu JZ, Thein SL. The carrier state for sickle cell disease is not completely harmless. Haematologica. 2019;104(6):1106-1111.
doi pubmed - Omoti CE. Hematological values in sickle cell anemia in steady state and during vaso-occlusive crisis in Benin City, Nigeria. Ann Afr Med. 2005;4:62-67.
- Khedr E, Hamed SA, Elbeih E, El-Shereef H, Ahmad Y, Ahmed S. Iron states and cognitive abilities in young adults: neuropsychological and neurophysiological assessment. Eur Arch Psychiatry Clin Neurosci. 2008;258(8):489-496.
doi pubmed - Khaled SA, Seifeldein GS. Splenomegaly in patients with sideropenic anemia: clinical and hematologic significance. J Hematol. 2016;5(3):83-93.
doi - Mohanty D, Mukherjee MB, Colah RB, et al. Iron deficiency anemia in sickle cell disorders in India. India J Med Res. 2008;127:366-369.
- Akodu SO, Njokanma OF, AdeoluKehinde O. Erythrocyte indices in pre-school nigerian children with sickle cell anaemia in steady state. Int J Hematol Oncol Stem Cell Res. 2015;9(1):5-9.
- Mouele R, Boukila V, Fourcade V, Feingold J, Galacteros F. Sickle-cell disease in Brazzaville, Congo: genetical, hematological, biochemical and clinical aspects. Acta Haematol. 1999;101(4):178-184.
doi pubmed - Jeddoa Z. Evaluation of (HPLC) patterns of sickle cell anaemia patients in comparison with apparently healthy individuals. Perspect Med Res. 2011;5(3):52-56.
- Trompeter S, Roberts I. Haemoglobin F modulation in childhood sickle cell disease. Br J Haematol. 2009;144(3):308-316.
doi pubmed - Lonergan GJ, Cline DB, Abbondazo SL. Sickle cell anemia. Radiographics. 2001;21:974-994.
doi pubmed - Platt OS, Brambilla DJ, Rosse WF, Milner PF, Castro O, Steinberg MH, Klug PP. Mortality in sickle cell disease. Life expectancy and risk factors for early death. N Engl J Med. 1994;330(23):1639-1644.
doi pubmed - Bouva MJ, Mohrmann K, Brinkman HB, Kemper-Proper EA, Elvers B, Loeber JG, Verheul FE, et al. Implementing neonatal screening for haemoglobinopathies in the Netherlands. J Med Screen. 2010;17(2):58-65.
doi pubmed - Nelson DA, Deuster PA, Carter R 3rd, Hill OT, Wolcott VL, Kurina LM. Sickle cell trait, rhabdomyolysis and mortaliy among U.S. army soldiers. N Engl J Med. 2016;375:435-442.
doi pubmed - Pinto DMR, do Sacramento MS, Santos PHS, Silva WS, de Oliveira EC, Gardenghi G, Ladeia AMT, et al. Physical exercise in sickle cell anemia: a systematic review. Hematol Transfus Cell Ther. 2021;43(3):324-331.
doi pubmed - Stienberg MH. Predicting severity in Sickle Cell Anemia. Br J Haematol. 2005;129:465-481.
doi pubmed - Arishi WA, Alhadrami HA, Zourob M. Techniques for the detection of sickle cell disease: a review. Micromachines (Basel). 2021;12(5):519.
doi pubmed
This article is distributed under the terms of the Creative Commons Attribution Non-Commercial 4.0 International License, which permits unrestricted non-commercial use, distribution, and reproduction in any medium, provided the original work is properly cited.
Journal of Hematology is published by Elmer Press Inc.