Figures
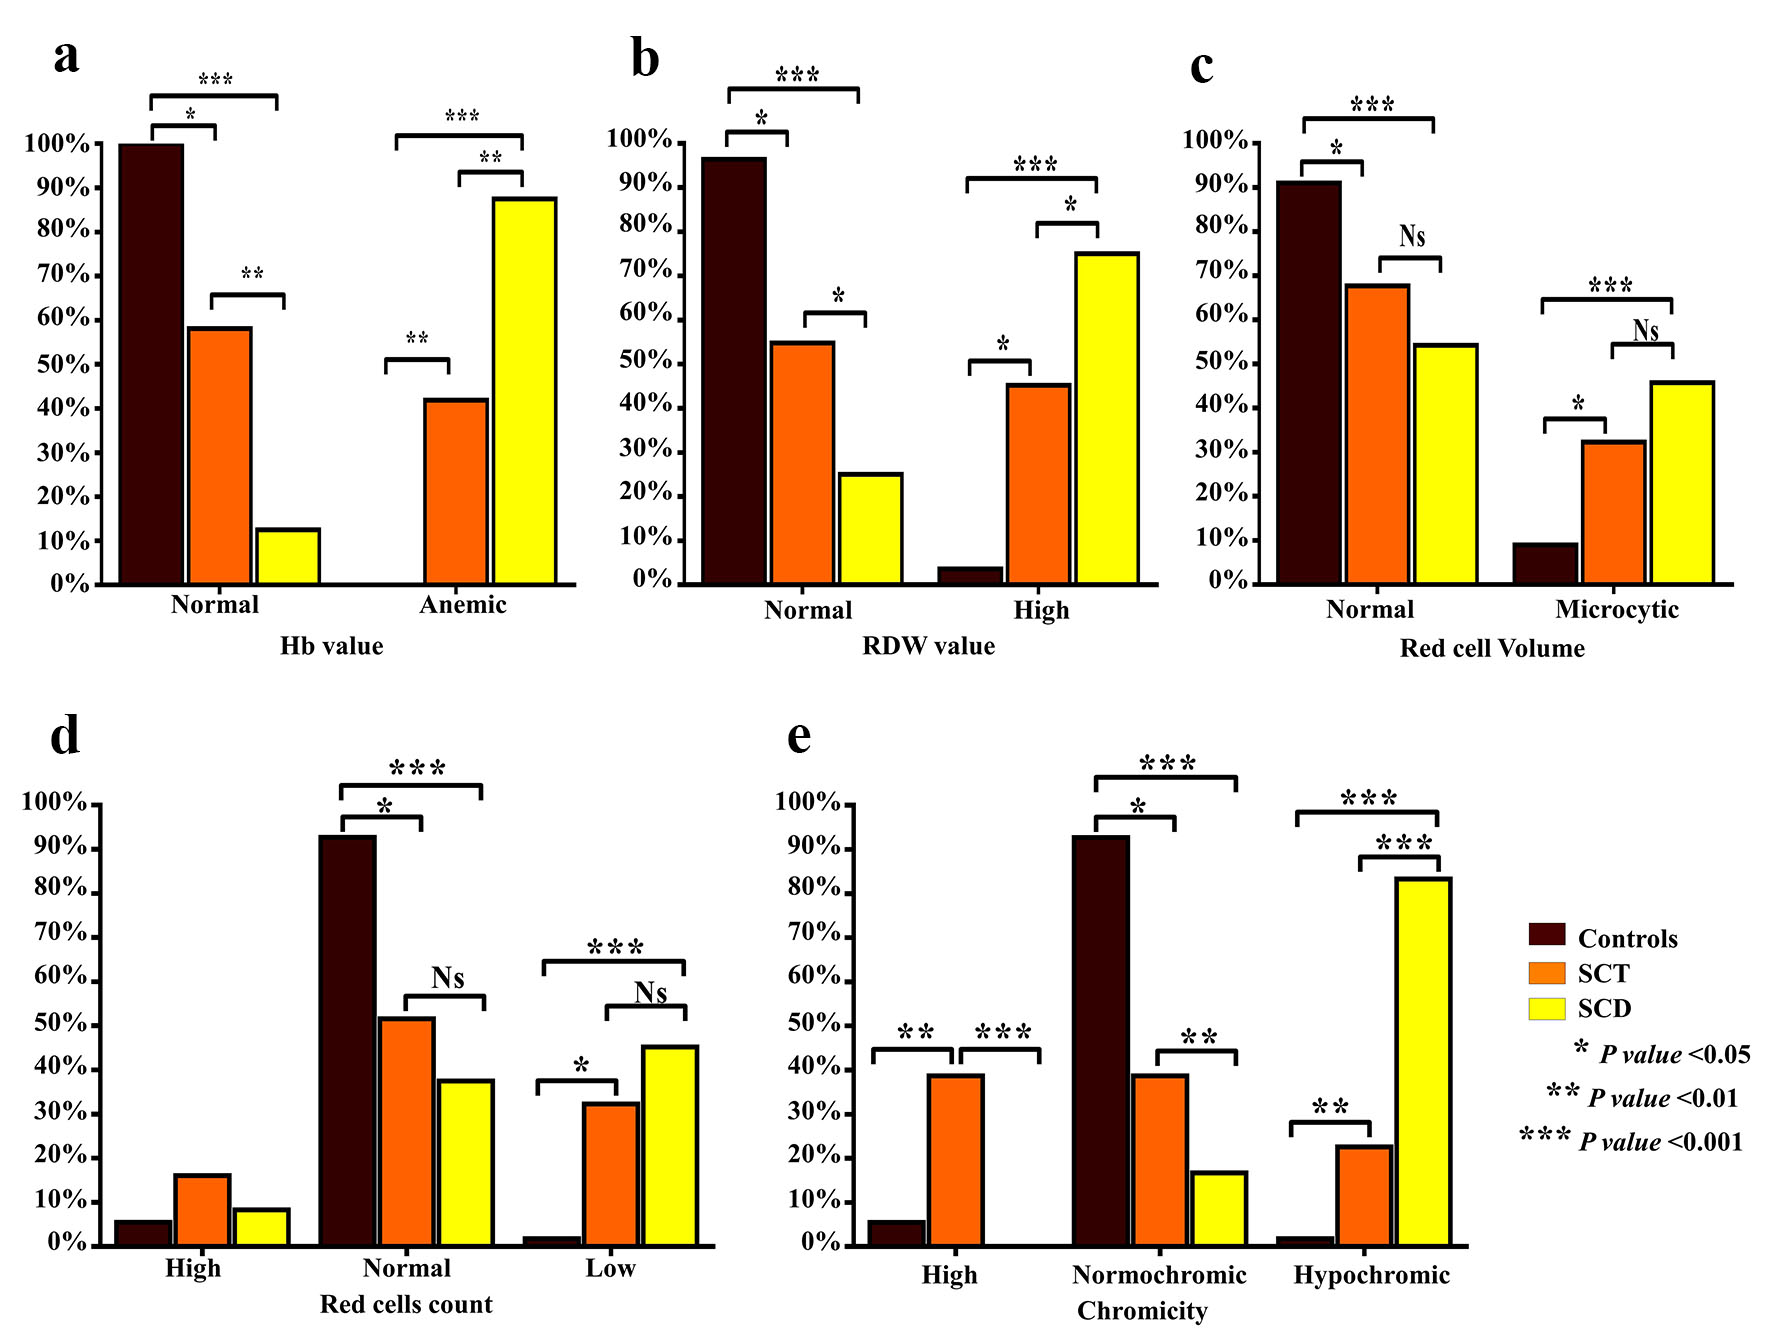
Figure 1. Comparison of characteristics of anemia between SCT subjects and SCD patients. Bar graphs show the percentages of Hb values (g/dL) (a), RDW value (b), the RBC count (× 106/L) (c), RBC volume (MCV, fL) (d) and chromicity (MCHC, g/dL) (e). SCT: sickle cell trait; SCD: sickle cell disease; Hb: hemoglobin; RDW: red cell distribution width; RBC: red blood cell; MCV: mean corpuscular volume; MCHC: mean corpuscular hemoglobin concentration.
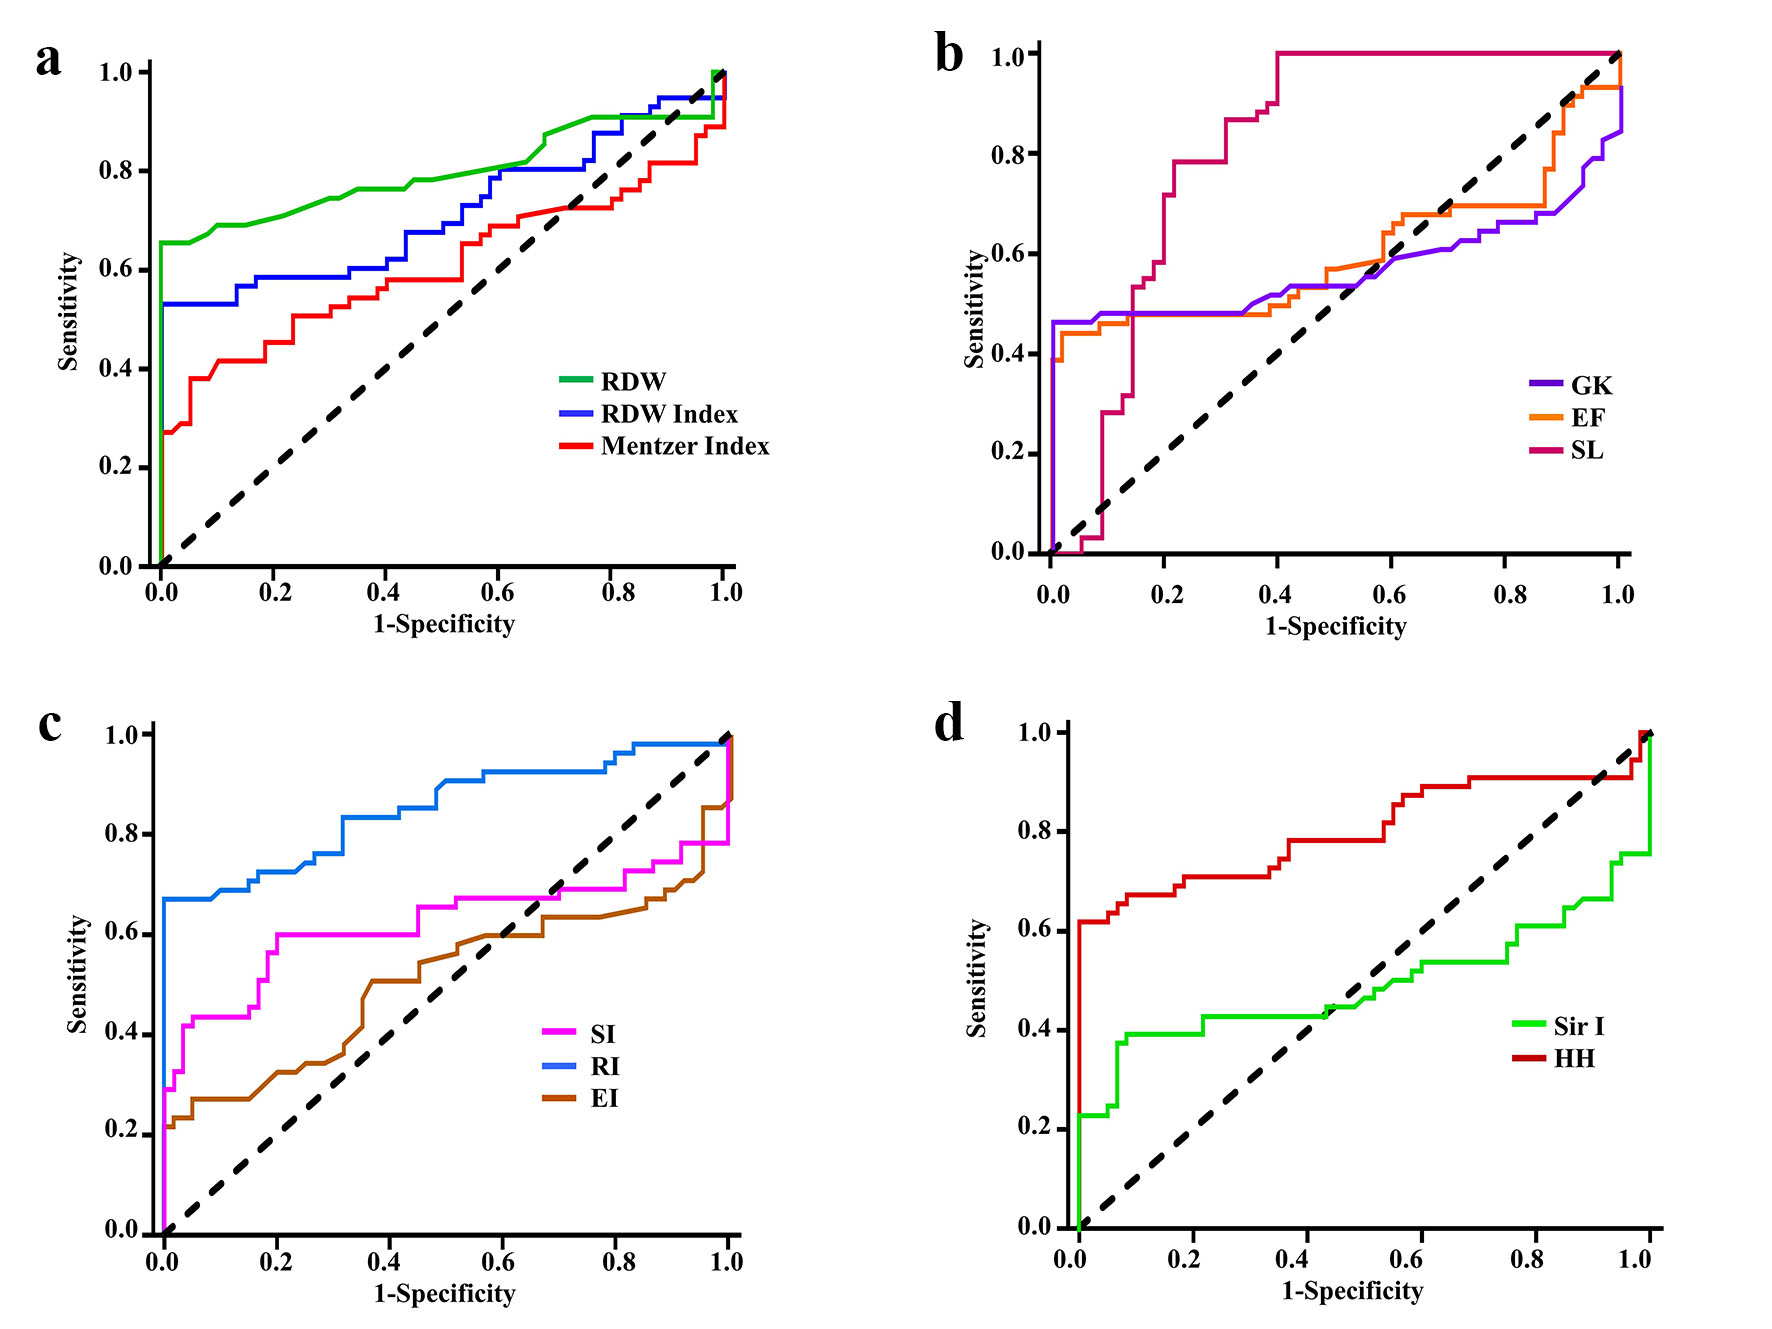
Figure 2. Receiver operating characteristic curves for discriminating cases with Hb S variant (group 1) from healthy controls by: (a) RDW, RDWI and Mentzer index, (b) GK, EF and SLI, (c) SI, RI and EI, and (d) Sir I and HH. Hb: hemoglobin; RDW: red cell distribution width; RDWI: red cell distribution width index; GK: Green and King index; EF: England and Frazer index; SL: Shine and Lal index; SI: Srivastava index; RI: Ricerca index; EI: Ehsani index; Sir I: Sirdah index; HH: Huber-Herklotz index.
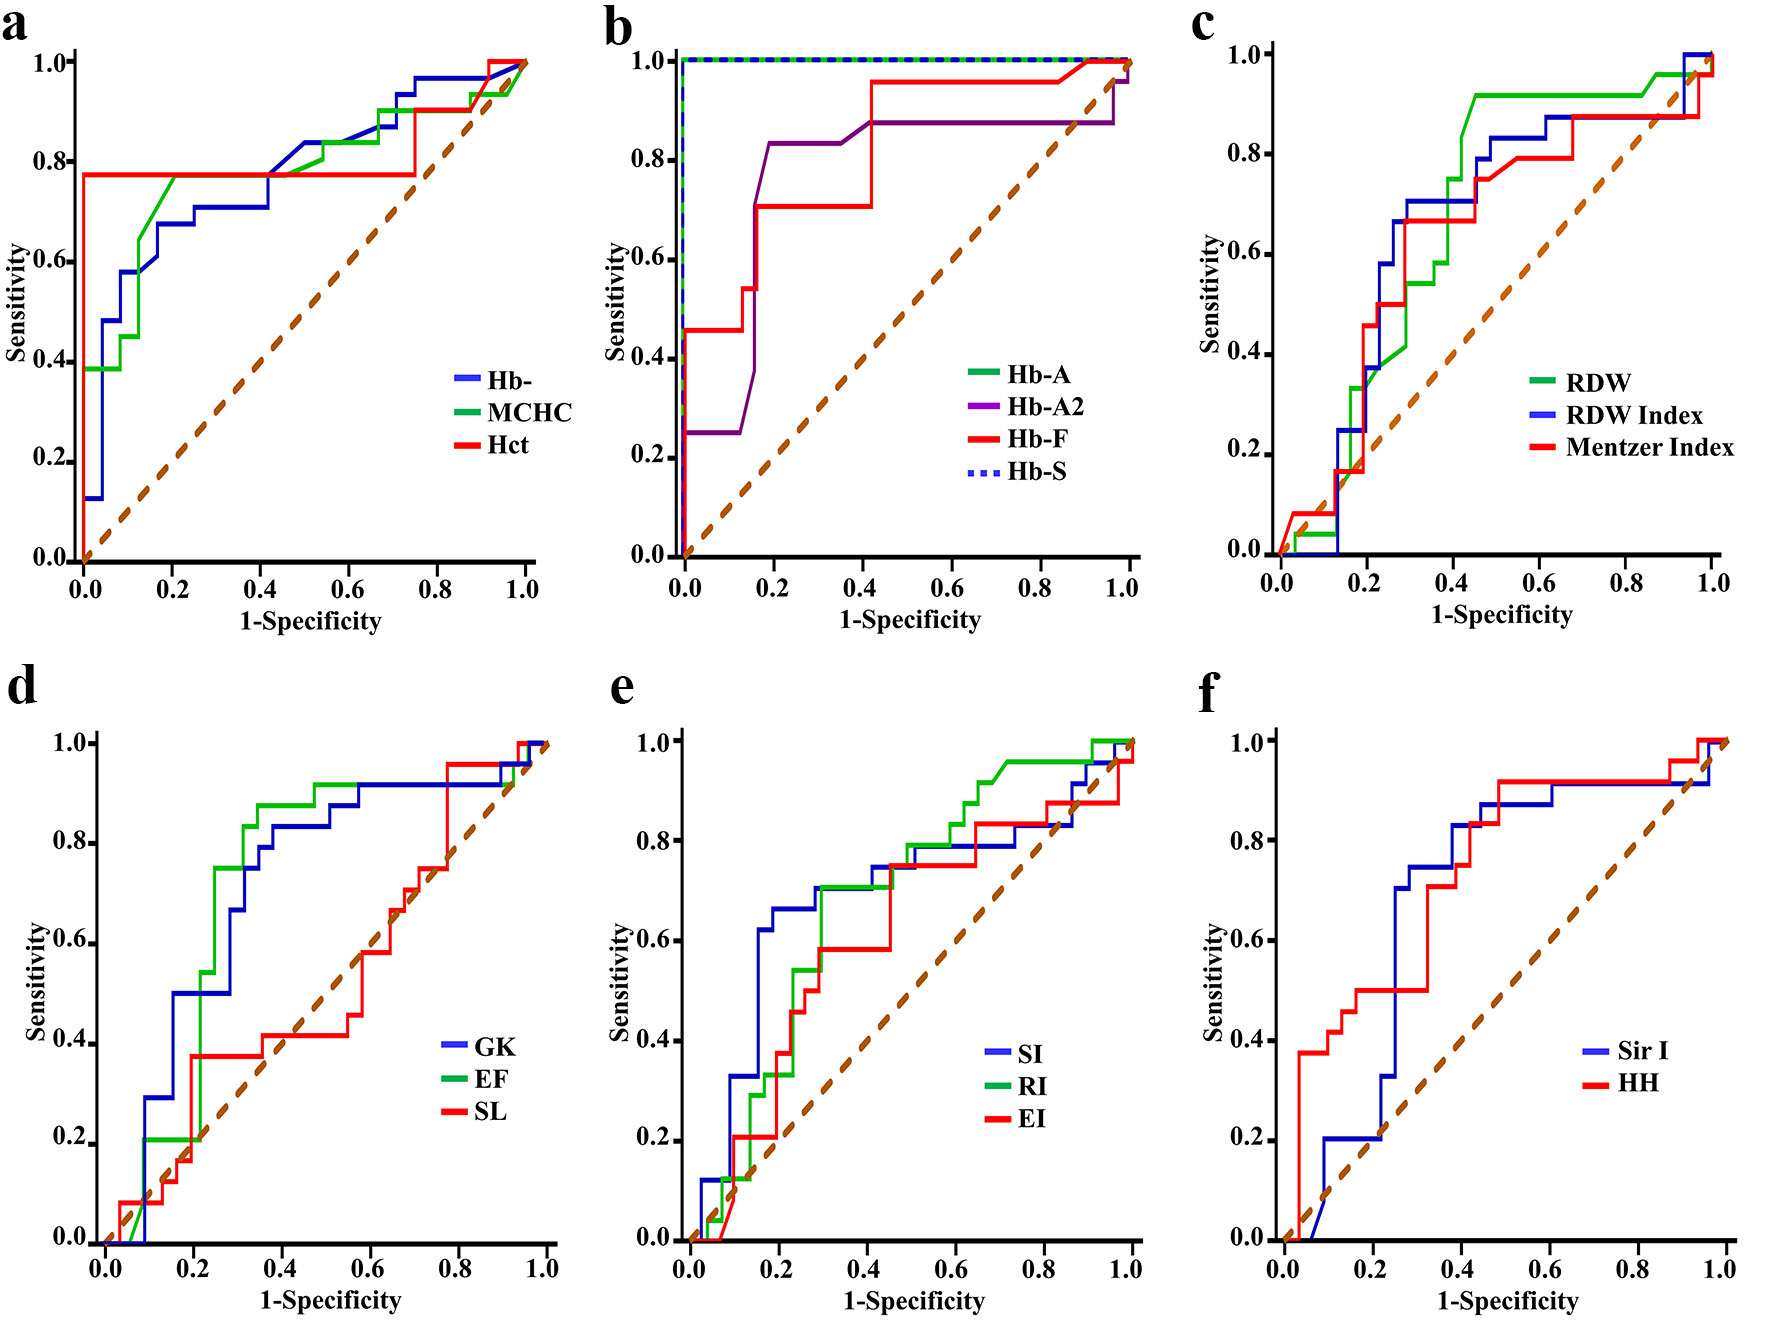
Figure 3. Receiver operating characteristic curves for discriminating patients with SCD from subjects with SCT by: (a) Hb, MCHC and Hct, (b) Hb A, Hb A2, Hb F and Hb S, (c) RDW, RDWI and Mentzer index, (d) GK, EF and SL, (e) SI, RI and EI, and (f) Sir I and HH. SCT: sickle cell trait; SCD: sickle cell disease; Hb: hemoglobin; MCHC: mean corpuscular hemoglobin concentration; Hct: hematocrit; RDW: red cell distribution width; RDWI: red cell distribution width index; GK: Green and King index; EF: England and Frazer index; SL: Shine and Lal index; SI: Srivastava index; RI: Ricerca index; EI: Ehsani index; Sir I: Sirdah index; HH: Huber-Herklotz index.
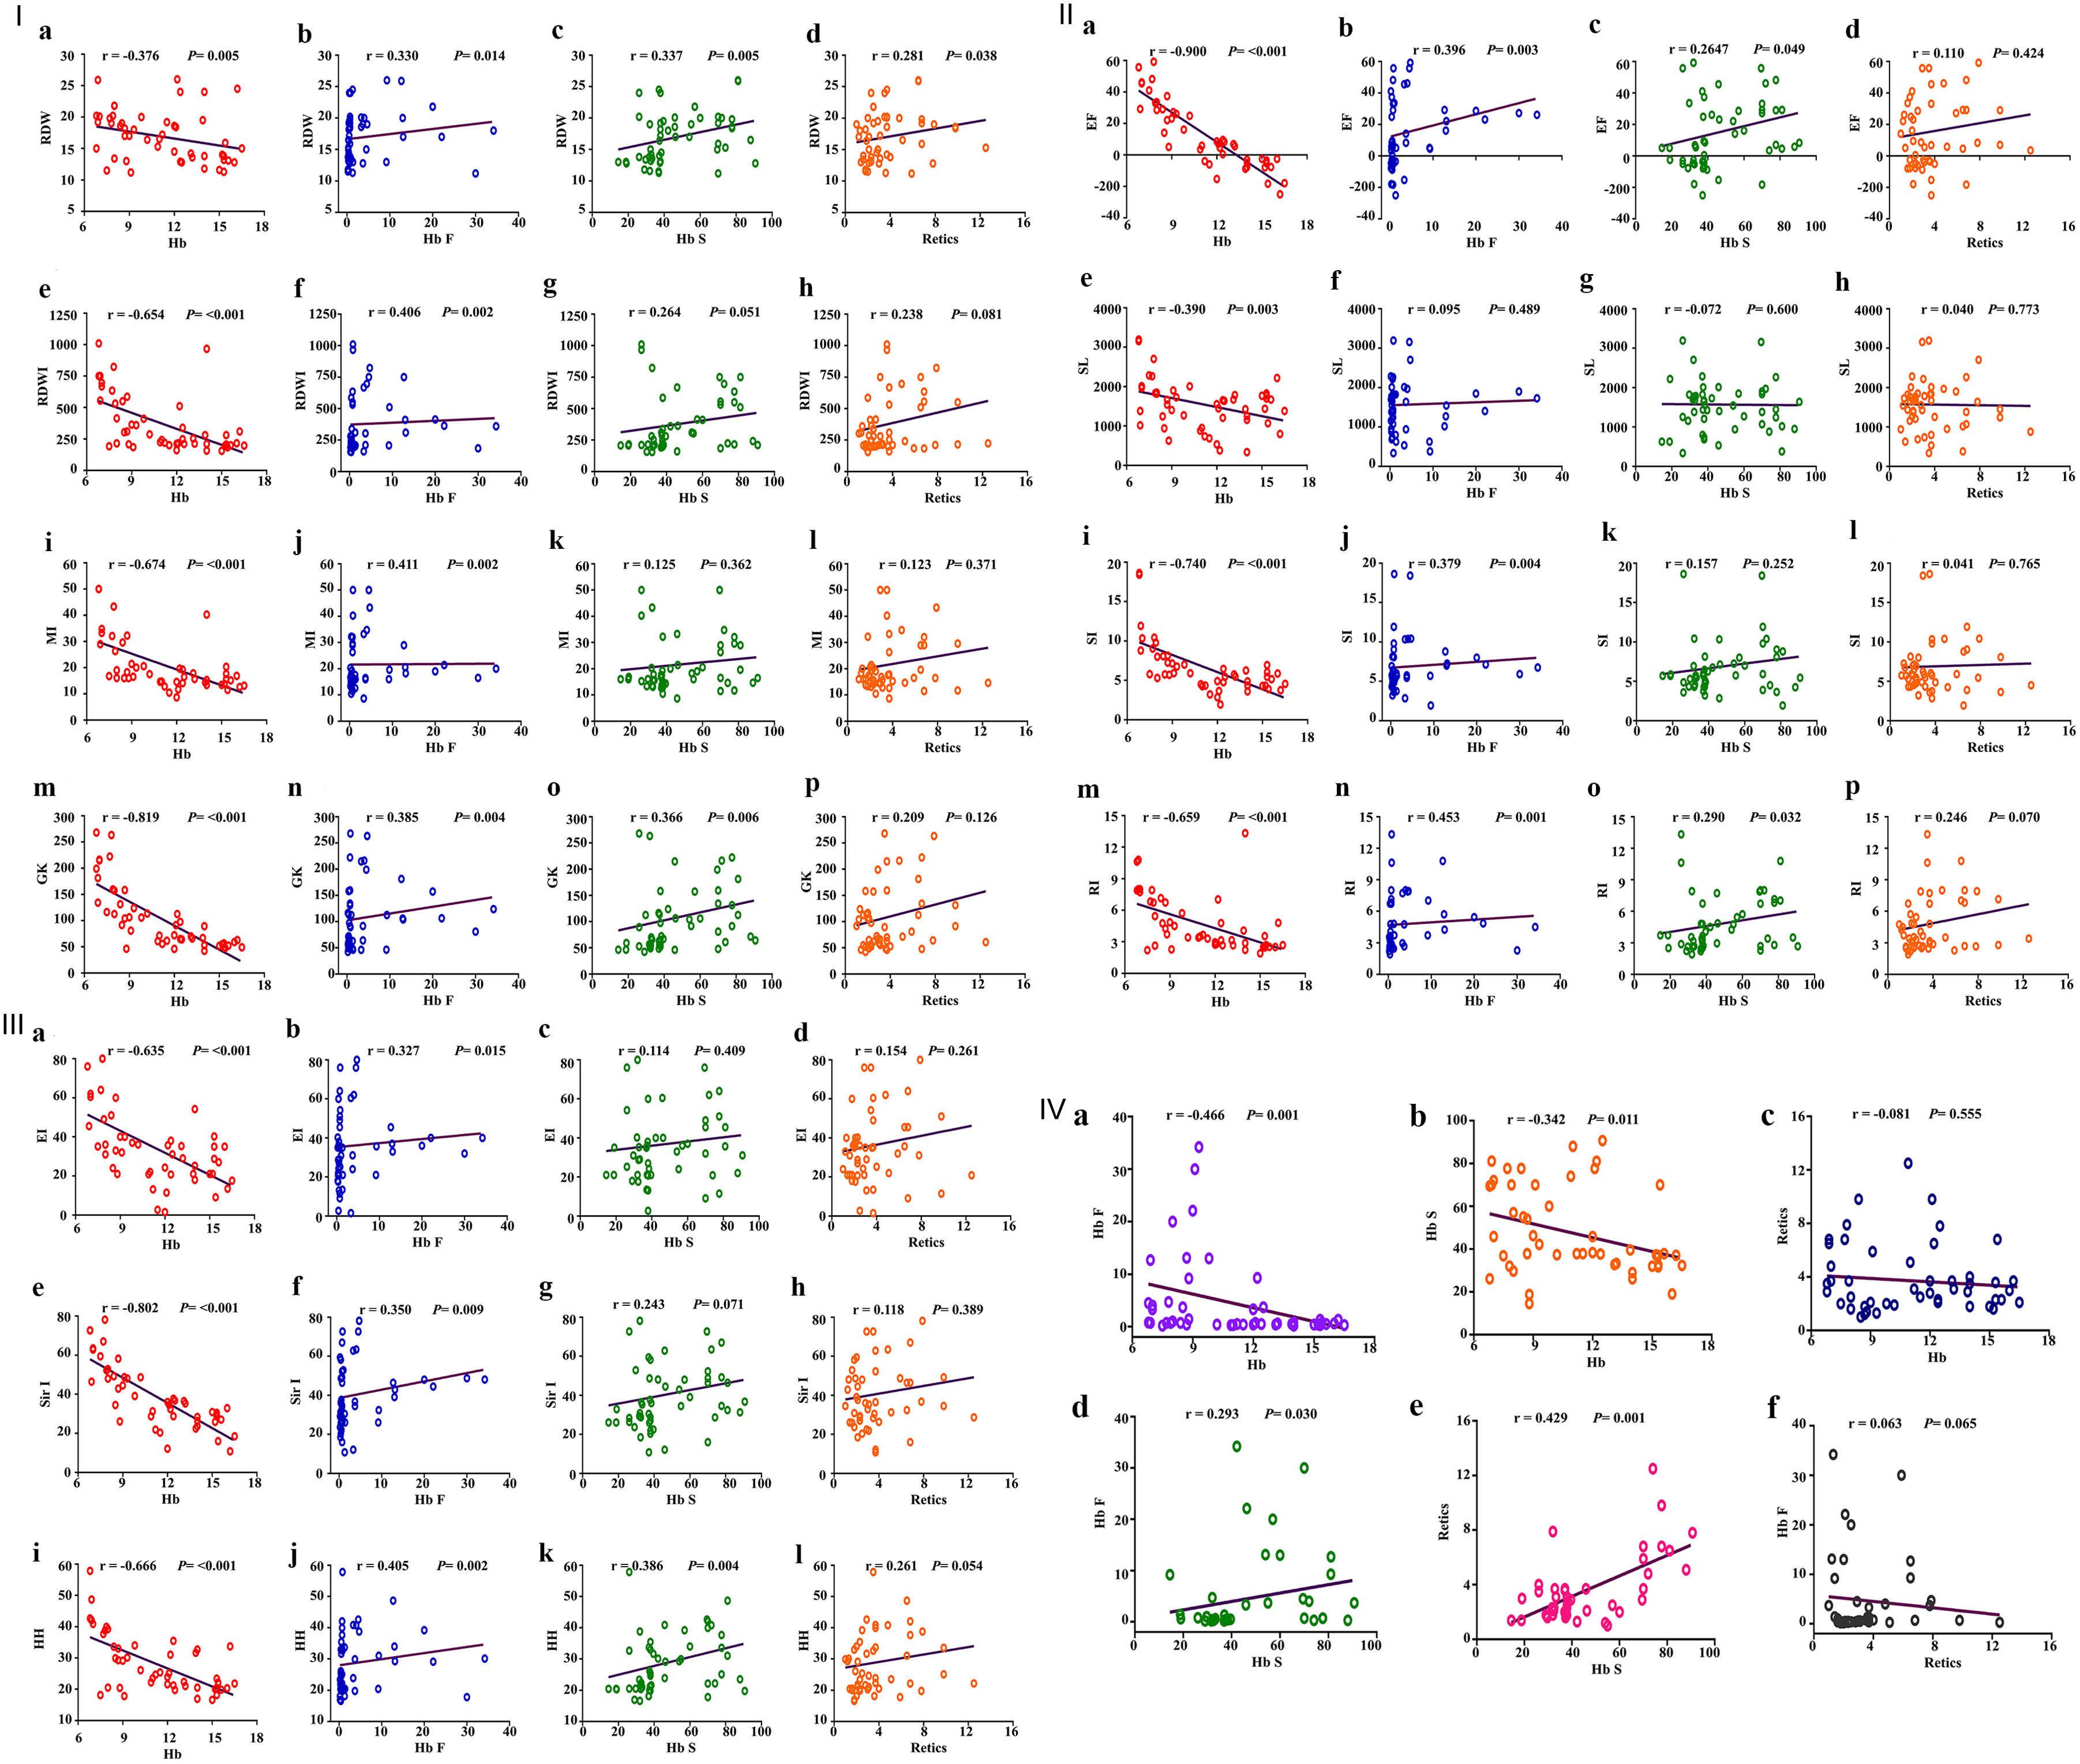
Figure 4. I: Schematic box plots representing the correlations of RDW, RDWI, MI and GKI results with hematological parameters among hemoglobin S variant cases. First, correlation between RDW and (a) Hb levels, (b) Hb F, (c) Hb S, (d) reticulocyte count; second, correlation between RDWI and (e) Hb levels, (f) Hb F, (g) Hb S, (h) reticulocyte count; third, correlation between Mentzer index and (i) Hb levels, (j) Hb F, (k) Hb S, (l) reticulocyte count; fourth, correlation between GK and (m) Hb levels, (n) Hb F, (o) Hb S, (p) reticulocyte count. II: Schematic box plots representing the correlations of (a-d) EF, (e-h) SL, (i-l) SI and (m-p) RI results with hematological parameters among hemoglobin S variant cases. Correlated as indicated in the figure. III: Schematic box plots representing the correlations of (a-d) EI, (e-h) Sir I and (i-l) HH results with hematological parameters among hemoglobin S variant cases. Correlated as indicated in the figure. IV: Schematic box plots representing correlations of some hematological parameters (a-f) among hemoglobin S variant cases. RDW: red blood cell distribution width; RDWI: red blood cell distribution width index; MI: Mentzer index; GKI: Green and King index; EF: England and Frazer index; SL: Shine and Lal index; SI: Srivastava index; RI: Ricerca index; EI: Ehsani index; Sir I: Sirdah index; HH: Huber-Herklotz index. r: Spearman rank correlation coefficient; P: P value.
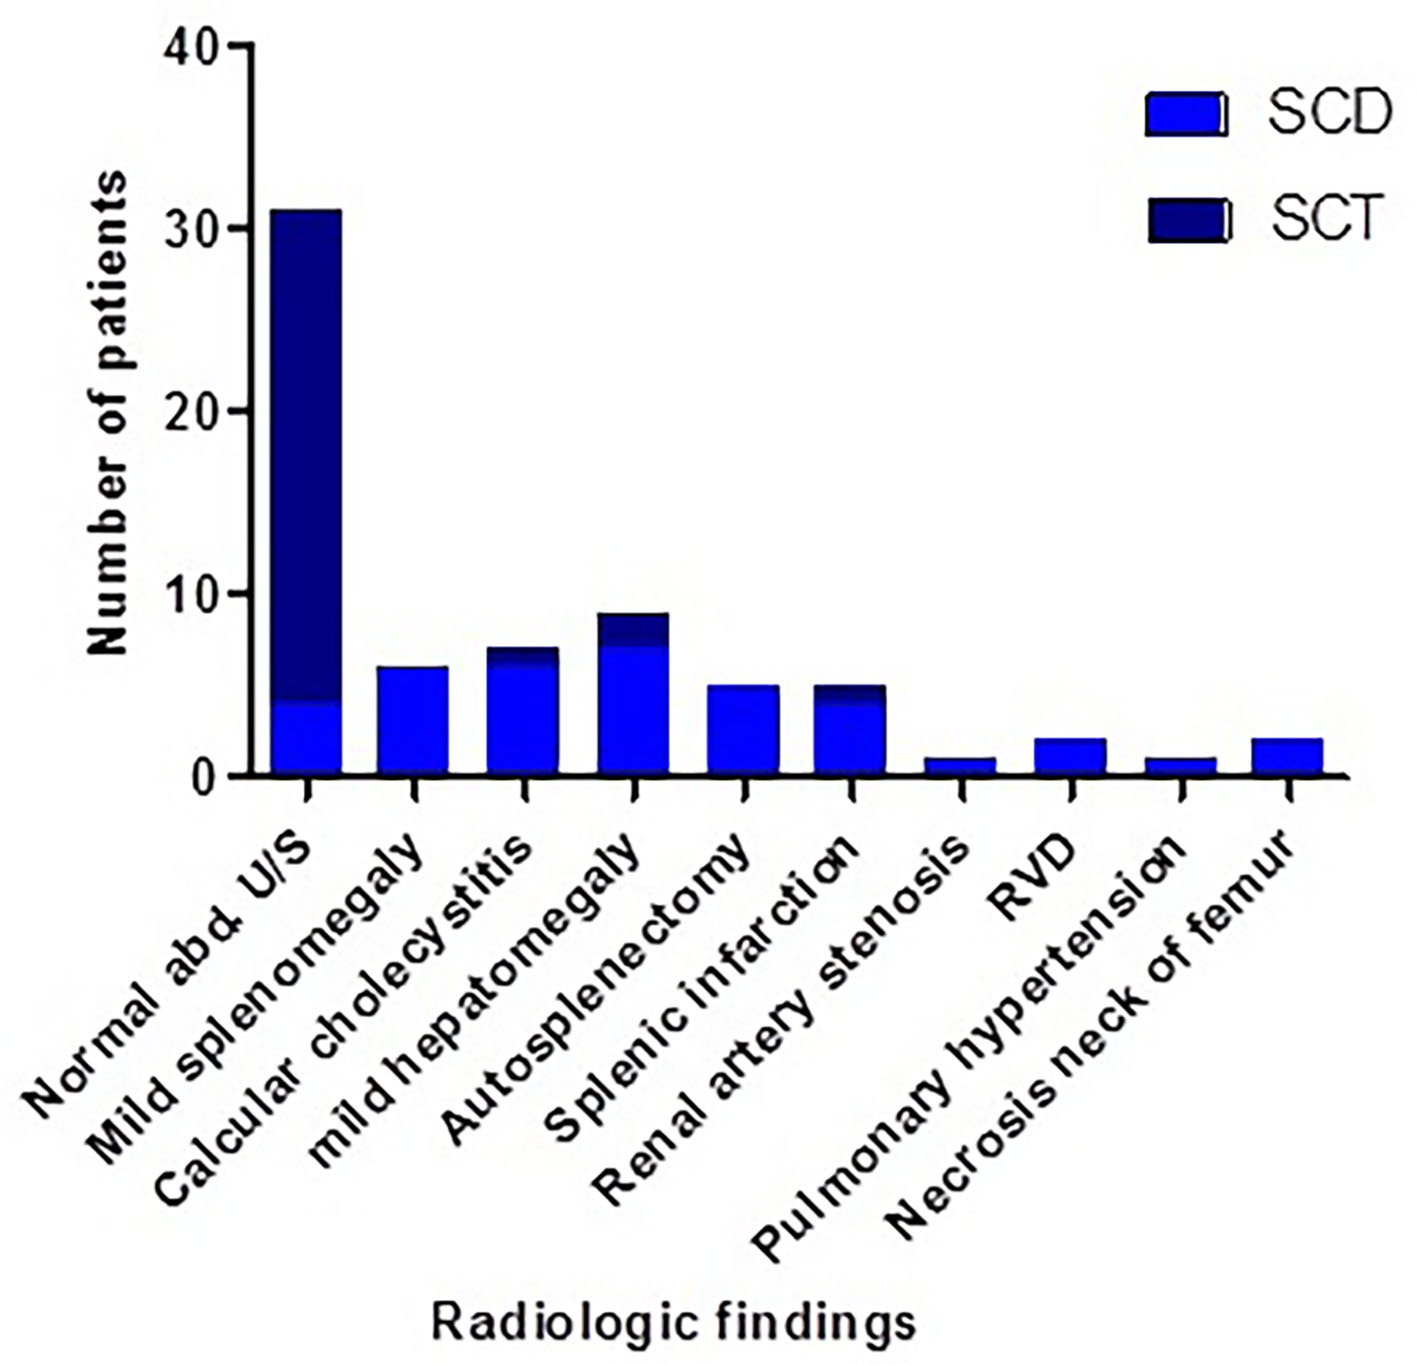
Figure 5. Radiological findings of SCD and SCT cases of the study. SCT: sickle cell trait; SCD: sickle cell disease.
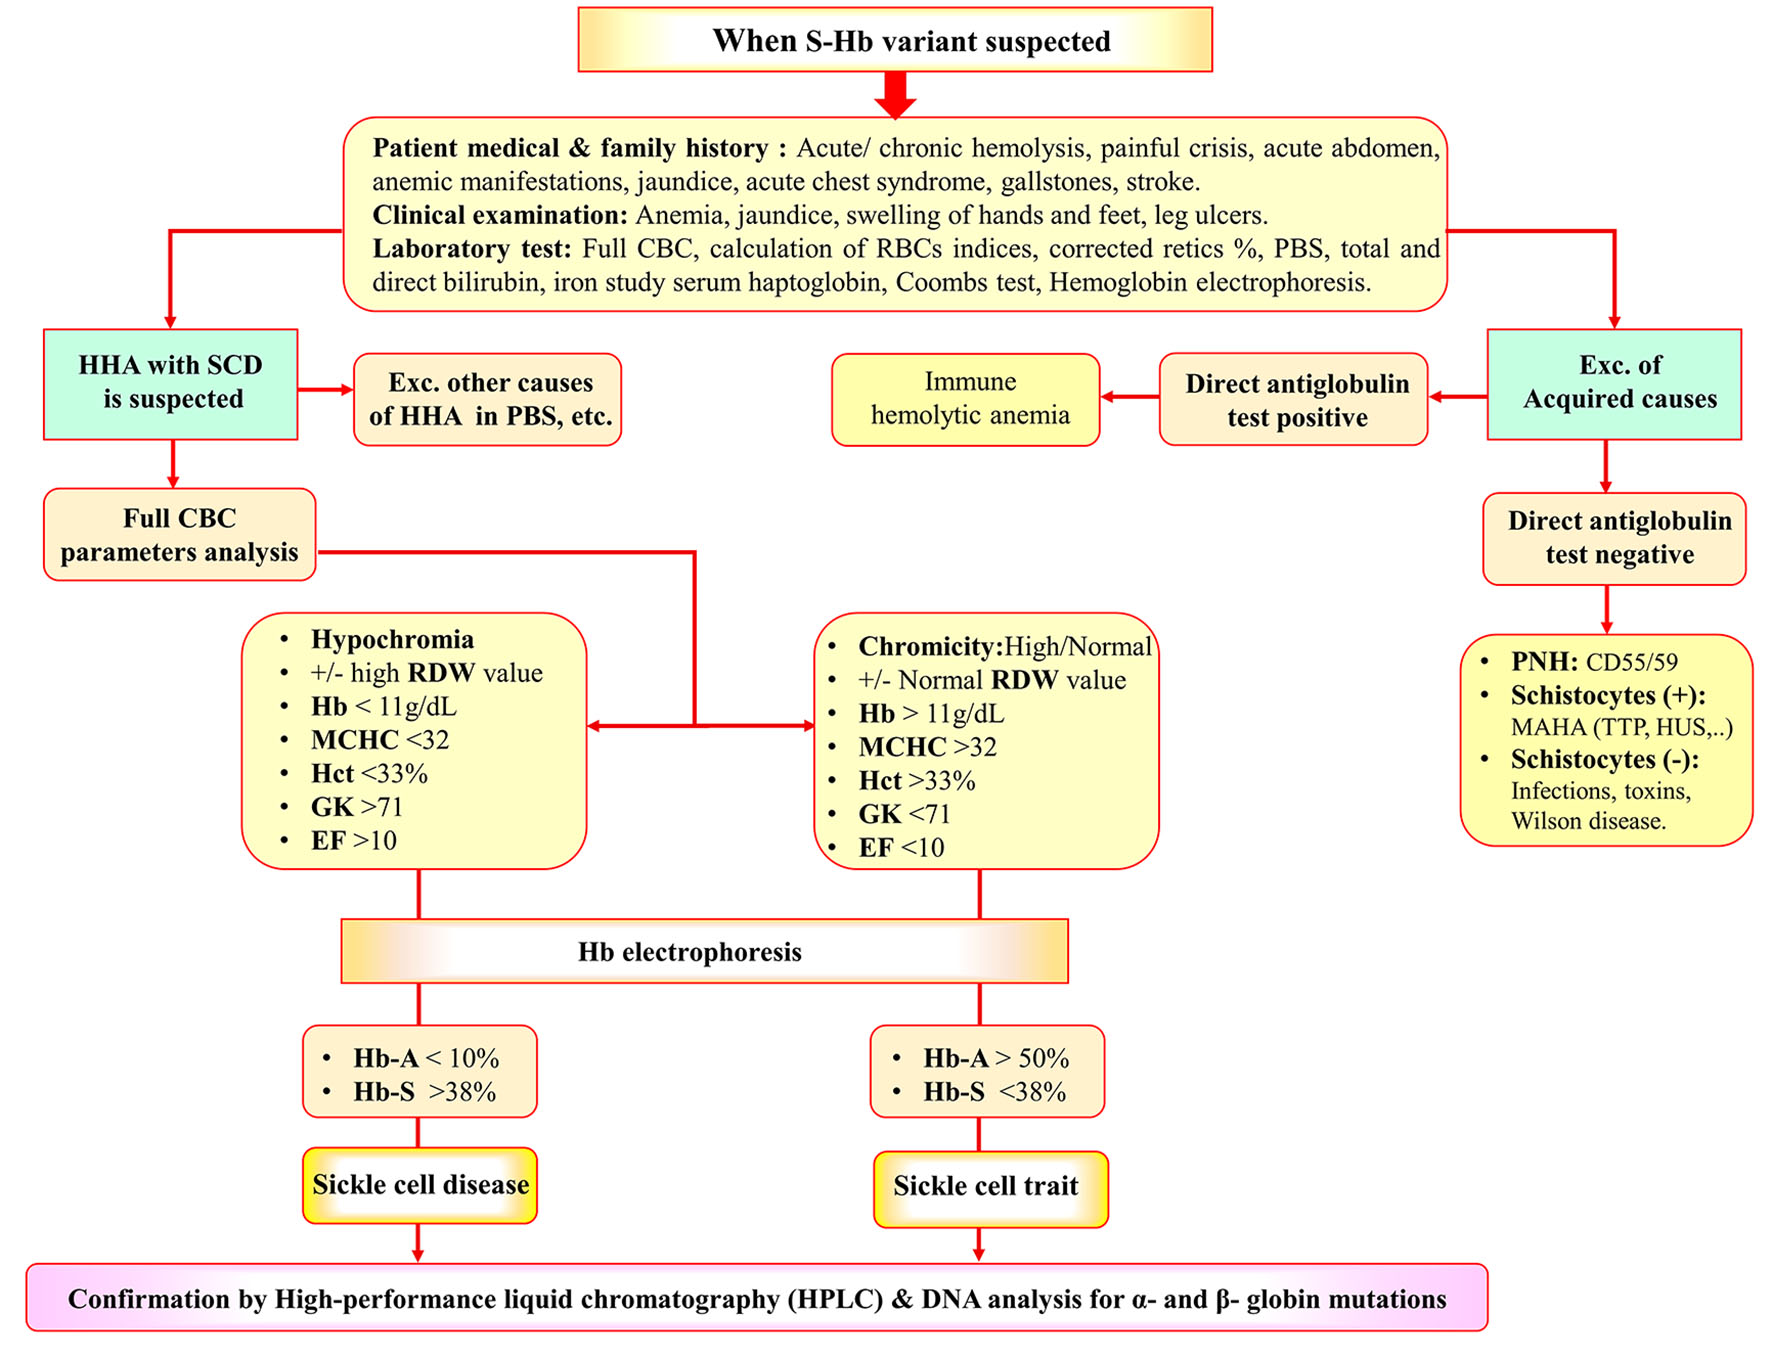
Figure 6. Diagnostic algorithm for identification of SCD and SCT. SCT: sickle cell trait; SCD: sickle cell disease; HHA: hereditary hemolytic anemia; CBC: complete blood cell count; PBS: peripheral blood smear; AIHA: autoimmune hemolytic anemia; MAHA: microangiopathic hemolytic anemia; TTP: thrombotic thrombocytopenic purpura; HUS: hemolytic uremic syndrome; PNH: paroxysmal nocturnal hemoglobinuria.
Tables
Table 1. Demographic, Clinical and Hematological Characteristics of Studied Groups
| Variable, n (%) | Hb S variant (group 1) (n = 55) | Controls (group 2) (n = 60) | P- value | SCD (group 1a) (n = 24) | SCT (group 1b) (n = 31) | P-value |
|---|
| P value was calculated with unpaired sample t-test. *P value was calculated with the Mann-Whitney test. #P value was calculated with the χ2 test. P value < 0.05 was considered significant. SCD: sickle cell disease; SCT: sickle cell trait; SD: standard deviation; CBC: complete blood cell count; WBC: white blood cell; RBC: red blood cell; Hb: hemoglobin; MCV: mean corpuscular volume; MCH: mean corpuscular hemoglobin; MCHC: mean corpuscular hemoglobin concentration; Hct: hematocrit; MI: Mentzer index; RDW: red cell distribution width; RDWI: red cell distribution width index; GK: Green and King index; EF: England and Fraser index; SL: Shine and Lal index; SI: Srivastava index; RI: Ricerca index; EI: Ehsani index; Sir I: Sirdah index; HH: Huber-Herklotz index. |
| Age (years) | | | 0.796 | | | 0.041 |
| Mean ± SD | 26.35 ± 9. 85 | 25.93 ± 11.77 | | 25.96 ± 10.31 | 30.71 ± 9.73 | |
| Median | 26 | 27 | | 22 | 29 | |
| Range | 18 - 52 | 18 - 45 | | 18 - 48 | 18 - 52 | |
| Gender | | | 0.193# | | | |
| Male | 31 (56.4) | 26 (43.3) | | 14 (58.3) | 17 (54.8) | 0.421 |
| Female | 24 (43.6) | 34 (56.7) | | 10 (41.7) | 14 (45.2) | |
| Residence | | | 0.074# | | | 0.863# |
| Assiut | 18 (32.7) | 21 (35) | | 9 (37.5) | 9 (41.9) | |
| El Minia | 1 (1.8) | 4 (6.7) | | 1 (4.2) | 0 (0.0) | |
| Sohag | 12 (21.8) | 27 (45) | | 6 (25) | 6 (35.5) | |
| Qena | 8 (14.5) | 5 (8.3) | | 1 (4.2) | 7 (0.0) | |
| Luxor | 2 (3.6) | 0 (0.0) | | 1 (4.2) | 1 (3.2) | |
| Aswan | 3 (5.5) | 1 (1.7) | | 1 (4.1) | 2 (3.2) | |
| Red Sea | 5 (9.1) | 2 (3.3) | | 2 (8.3) | 3 (6.5) | |
| New Valley | 6 (10.9) | 0 (0.0) | | 3 (12.5) | 3 (3.2) | |
| Clinical presentation | | | | | | 0.000# |
| Acute hemolysis | 11 (20) | | | 9 (37.5) | 2 (6.4) | |
| Painful crisis | 9 (16.3) | | | 8 (33.3) | 1 (3.2) | |
| Acute abdomen | 4 (7.3) | | | 4 (16.3) | 0 (0) | |
| Anemic manifestations | 19 (34.5) | | | 6 (25) | 1 (3.2) | |
| Jaundice | 4 (7.2) | | | 3 (12.5) | 1 (3.2) | |
| Acute chest syndrome | 2 (3.6) | | | 2 (8.3) | 0 (0) | |
| Obstructive jaundice | 7 (12.7) | | | 6 (25) | 1 (3.2) | |
| Accidental discovery | 15 (27.2) | | | 0 (0.0) | 25 (80.6) | |
| Nephropathy | 3 (5.4) | | | 2 (8.3) | 1 (3.2) | |
| Aplastic crisis | 2 (3.6) | | | 2 (8.3) | 0 (0) | |
| CBC | | | | | | |
| WBCs (× 103/L) | 7.72 ± 4.34 | 7.33 ± 1.75 | 0.163 | 8.83 ± 5.30 | 6.86 ± 3.25 | 0.502 |
| RBCs (× 106/L) | 5.01 ± 4.93 | 5.92 ± 0.53 | < 0.001 | 3.78 ± 1.31 | 5.96 ± 6.34 | 0.050 |
| Hb (g/dL) | 10.65 ± 3.31 | 14.22 ± 1.54 | < 0.001 | 9.10 ± 2.20 | 11.85 ± 3.55 | < 0.001 |
| MCV (fL) | 74.67 ± 17.79 | 85.72 ± 4.32 | < 0.001 | 76.48 ± 9.86 | 73.27 ± 22.14 | 0.830 |
| MCH (pg) | 25.10 ± 5.43 | 28.27 ± 1.20 | < 0.001 | 26.31 ± 4.59 | 24.17 ± 5.91 | 0.391 |
| MCHC (g/dL) | 36.21 ± 10.61 | 32.59 ± 1.26 | 0.518 | 31.29 ± 2.14 | 40.02 ± 12.84 | < 0.001 |
| Hct (%) | 35.42 ± 11.77 | 43.82 ± 3.03 | < 0.001 | 27.23 ± 3.84 | 41.76 ± 11.96 | < 0.001 |
| Reticulocytes (%) | 3.74 ± 2.54 | 0.9 ± 0.37 | < 0.001 | 4.72 ± 3.12 | 2.97 ± 1.67 | 0.045 |
| Platelets (× 103/L) | 300.67 ± 93.84 | 316.73 ± 60.11 | 0.149 | 316.13 ± 82.53 | 300.67 ± 93.84 | 0.247 |
| Targeted indices | | | | | | |
| MI | 20.56 ± 11.14 | 16.37 ± 2.03 | 0.046 | 23.37 ± 10.91 | 18.09 ± 3.11 | 0.086 |
| RDW (%) | 17.01 ± 3.86 | 13.26 ± 0.80 | < 0.001 | 17.01 ± 3.86 | 16.19 ± 4.22 | 0.030 |
| RDWI | 353.43 ± 24.80 | 216.71 ± 26.56 | < 0.001 | 424.99 ± 201.77 | 298.03 ± 229.09 | 0.040 |
| GK | 108.37 ± 63.09 | 69.19 ± 8.72 | 0.260 | 127 ± 55.91 | 93.20 ± 6.49 | 0.009 |
| EF | 15.5 ± 22.30 | 5.94 ± 8.26 | 0.076 | 23.79 ± 11.9 | 9.13 ± 22.67 | 0.008 |
| SL | 1,569.90 ± 656.78 | 2,089.21 ± 280.90 | < 0.001 | 1,608.6 ± 638.10 | 1,539.8 ± 679.80 | 0.773 |
| SI | 6.90 ± 3.54 | 5.39 ± 0.60 | 0.023 | 8.03 ± 3.94 | 6.01 ± 2.96 | 0.017 |
| RI | 4.81 ± 2.55 | 2.52 ± 0.28 | < 0.001 | 5.43 ± 2.25 | 4.32 ± 2.68 | 0.018 |
| EI | 36.06 ± 19.90 | 32.77 ± 7.34 | 0.799 | 38.60 ± 20.46 | 34.09 ± 19.56 | 0.164 |
| Sir I | 40.59 ± 17.11 | 37.78 ± 5.87 | 1.000 | 45.39 ± 15.45 | 36.88 ± 17.64 | 0.018 |
| HH | 28.90 ± 9.29 | 20.40 ± 1.26 | < 0.001 | 32.66 ± 8.64 | 26.00 ± 8.85 | 0.003 |
Table 2. T-Test Results of Hematological Parameters of SCT Subjects and Control Group
| Participant group | Mean | SD | P value |
|---|
| P value was calculated with unpaired sample t-test. SCT: sickle cell trait; SD: standard deviation; WBC: white blood cell; RBCs: red blood cells; Hb: hemoglobin; MCV: mean corpuscular volume; MCH: mean corpuscular hemoglobin; MCHC: mean corpuscular hemoglobin concentration; Hct: hematocrit; MI: Mentzer index; RDW: red cell distribution width; RDWI: red cell distribution width index; GK: Green and King index; EF: England and Fraser index; SL: Shine and Lal index; SI: Srivastava index; RI: Ricerca index; EI: Ehsani index; Sir I: Sirdah index; HH: Huber-Herklotz index. |
| WBCs (× 103/L) | Controls | 7.329 | 1.7476 | 0.138 |
| SCT | 7.048 | 2.9781 | |
| RBCs (× 106/L) | Controls | 5.296 | 0.5288 | < 0.001 |
| SCT | 4.368 | 1.2013 | |
| Hb (g/dL) | Controls | 14.218 | 1.5449 | 0.007 |
| SCT | 12.174 | 3.0627 | |
| MCV (fL) | Controls | 85.732 | 4.3223 | < 0.001 |
| SCT | 77.774 | 11.6808 | |
| MCH (pg) | Controls | 28.273 | 1.2038 | < 0.001 |
| SCT | 24.168 | 5.9053 | |
| MCHC (g/dL) | Controls | 32.592 | 1.2607 | 0.008 |
| SCT | 40.023 | 12.8395 | |
| Platelets (× 103/L) | Controls | 316.73 | 60.106 | 0.027 |
| SCT | 288.71 | 101.439 | |
| Hct (%) | Controls | 43.82 | 3.037 | 0.805 |
| SCT | 40.44 | 9.655 | |
| Reticulocytes (%) | Controls | 0.873 | 0.3654 | < 0.001 |
| SCT | 2.974 | 1.6733 | |
| Mentzer index | Controls | 16.3668 | 2.02790 | 0.779 |
| SCT | 20.3172 | 10.53331 | |
| RDW index | Controls | 216.71 | 26.55909 | 0.49 |
| SCT | 345.52 | 246.46697 | |
| RDW | Controls | 13.2650 | 0.80398 | 0.002 |
| SCT | 16.1903 | 4.22164 | |
| GK | Controls | 69.1987 | 8.71872 | 0.514 |
| SCT | 93.2031 | 64.98447 | |
| EF | Controls | 5.9440 | 8.26077 | 0.233 |
| SCT | 9.1348 | 22.67161 | |
| SL | Controls | 2,089.21 | 280.97225 | < 0.001 |
| SCT | 1,539.93 | 679.80101 | |
| SI | Controls | 5.3922 | 0.60189 | 0.763 |
| SCT | 6.0194 | 2.96136 | |
| RI | Controls | 2.5274 | 0.27603 | < 0.001 |
| SCT | 4.3260 | 2.68780 | |
| EI | Controls | 32.7717 | 7.34526 | 0.293 |
| SCT | 34.0903 | 19.56032 | |
| Sir I | Controls | 37.7807 | 5.87379 | 0.016 |
| SCT | 36.8832 | 17.64508 | |
| HH | Controls | 20.4038 | 1.25761 | 0.001 |
| SCT | 26.0023 | 8.85158 | |
Table 3. Differences of Hemoglobin Fractions Between SCT Subjects and Control Group
| Hb | Groups | Mean | Std. deviation | Std. error mean | P-value |
|---|
| Hb: hemoglobin; SCT: sickle cell trait. |
| Hb A | SCT | 62.45 | 11.45 | 2.0570 | 0.000 |
| Controls | 96.770 | 0.5097 | 0.0658 | |
| Hb A2 | SCT | 3.37 | 0.47 | 0.9562 | 0.009 |
| Controls | 2.623 | 0.2619 | 0.0338 | |
| Hb F | SCT | 1.400 | 2.35 | 0.4229 | 0.014 |
| Controls | 0.61 | 0.51 | 0.0650 | |
| Hb S | SCT | 34.78 | 10.59 | 1.9412 | 0.000 |
| Controls | 0.000 | 0.0000 | 0.0000 | |
Table 4. Receiver Operating Characteristic Curve Analysis Results and Predictive Values of Evaluated Indices for Differential Diagnosis of SCT Subjects and Control Group
| Variable | AUC (95%) | Cut-off | Sens (%) | Spec (%) | PPV (%) | NPV (%) | % Correctly identified | YI | P value |
|---|
| AUC: area under the curve; Sens: sensitivity; Spec: specificity; PPV: positive-predictive value; NPV: negative-predictive value; YI: Youden’s index; SC: sickle cell; SCT: sickle cell trait; RBCs: red blood cell; Hb: hemoglobin; MCHC: mean corpuscular hemoglobin concentration; Hct: hematocrit; RDW: red blood cell distribution width; RDWI: red blood cell distribution width index; GK: Green and King index; EF: England and Frazer index; SL: Shine and Lal index; SI: Srivastava index; RI: Ricerca index; EI: Ehsani index; Sir I: Sirdah index; HH: Huber-Herklotz index. |
| MCHC | 0.67 (0.52 - 0.81) | SCT > 33.5 | 61% | 81% | 63% | 80% | 75% | 0.42 | 0.009 |
| Retics (%) | 0.98 (0.96 - 1.02) | SCT > 2% | 70% | 100% | 100% | 87% | 66% | 0.70 | < 0.001 |
| RDW (%) | 0.70 (0.56 - 0.83) | SCT > 14% | 54% | 85% | 65% | 78% | 74% | 0.39 | 0.002 |
| RDWI | 0.63 (0.49 - 0.76) | SCT > 240% | 54% | 80% | 59% | 77% | 71% | 0.29 | 0.049 |
| SL | 0.82 (0.70 - 0.93) | SCT < 1,780 | 88% | 71% | 58% | 76% | 82% | 0.59 | < 0.001 |
| RI | 0.79 (0.68 - 0.90) | SCT > 2.8 | 68% | 83% | 68% | 83% | 78% | 0.51 | < 0.001 |
| Sir I | 0.35 (0.19 - 0.50) | SCT > 35 | 26% | 52% | 22% | 58% | 43% | -0.22 | 0.016 |
| HH | 0.71 (0.58 - 0.84) | SCT > 21.5 | 55% | 78% | 56% | 77% | 70% | 0.33 | 0.001 |