


| Journal of Hematology, ISSN 1927-1212 print, 1927-1220 online, Open Access |
| Article copyright, the authors; Journal compilation copyright, J Hematol and Elmer Press Inc |
| Journal website http://www.thejh.org |
Original Article
Volume 5, Number 2, June 2016, pages 49-53
Complete Blood Count: Absolute or Relative Values?
Borros Arneth
Institute for Laboratory Medicine and Pathobiochemistry, Molecular Diagnostics, Justus Liebig University Giessen, Giessen, Germany. Hospital of the Universities Giessen and Marburg, UKGM, Feulgenstr. 12, 35392 Giessen, Germany
Manuscript accepted for publication April 14, 2016
Short title: Error Calculation in Hematology
doi: http://dx.doi.org/10.14740/jh265w
| Abstract | ▴Top |
Background: For many years, relative values based on 100 quantified cells have been used to assess blood counts in the field of hematology. However, modern blood counting machines have recently made it possible to determine absolute counts. Thus, the current study assessed whether the determination of relative values, based on 100 cells counted, or the determination of absolute values is more accurate in hematology.
Methods: To calculate the errors of absolute counts and of quotients, we used two independent methods to determine the errors. For the error calculation, we first performed a Gaussian error calculation. Second we identified the errors using daily control checks and examined the high limit of the actual errors (precision) on the Sysmex XE5000 hematological analyzer.
Results: Our findings indicated that the accuracy of the relative values was always much higher compared to the absolute values.
Conclusion: This finding can be explained by “combined errors” which affect absolute cell counts and which are directed for all cell counts of one run into the same direction. These types of errors are reduced by quotient formation as shown here for the basophils. The accuracy of the absolute values obtained from the hematology machines of the latest generation was acceptable due to the very high number of cells quantified.
Keywords: Complete cell count; Measurement; Errors; Comparison; Utility; Absolute values; Quotients; Relative values
| Introduction | ▴Top |
In the field of hematology, the cellular components of the blood are routinely quantified. However, the use of absolute or relative values remains controversial and has received conflicting opinions from doctors of various disciplines. Although internists increasingly pay attention to the absolute values in the complete cell count, representatives of other disciplines, such as pediatrics, also appreciate the relative values due to the larger constancy related to age dependency.
The error analysis in the clinical-chemical laboratory up now is done by comparing the measurement of a standardized quality control sample with a previously defined target value for this particular sample as well as by assessing the precision of this quality control. This procedure has been described by a variety of authors [1-7]. Furthermore, different methods and schemes (e.g. the control chart and the Shewhart chart) have been described for assessing and evaluation of the resulting precession curves [2-6].
The cellular components of blood consist of platelets, erythrocytes, and different leukocytes, such as neutrophils, eosinophils, granulocytes, basophils, monocytes and lymphocytes. The determination of absolute values in hematology remains a relatively young discipline, and it has only recently become possible to identify absolute concentrations of cellular values. In particular, the new generation of hematology machines has enabled this advancement; machines of this generation can quantify and differentiate very high numbers of cells, i.e., cell counts within the range of several thousand to tens of thousands of analyzed cells. For example, the Sysmex XE 5000, as well as other systems from other manufacturers, can differentiate a large number of cells.
The current study investigated whether relative values, i.e., those based on 100 cells counted, or absolute values are more accurate. First, we addressed whether such analyses should be performed using the mean of the error calculation according to the Gaussian principle. Second, we evaluated whether the error calculation should be determined on the basis of a review of the controls. For this purpose, daily control measurements were performed and subsequently evaluated using various system devices. The equipment systems used to analyze these controls included the XE 5000 and the XS800, which were created by Sysmex and are common hematology machines used in many labs, and the Diffmaster (a system based on pattern recognition of cell differentiation), which was created by CellaVision. The third approach was the manual differentiation method, which was performed by trained hematology personnel. Next, we calculated the respective actual error that occurred with reference to the quality control, and we then performed a Gaussian error calculation, which provides the maximum theoretical error. Next, we examined and compared the error as given by the quotient formation, including the error with the relative values, the error of the absolute values based on the Gaussian theory of errors, and the error based on the actual value of variations of measurements compared with the respective control. Consequently, we observed very strong fluctuations of the absolute values. However, the relative values appeared to be more constant. Our results demonstrated that the measurement accuracy was analytically much higher for the relative values compared with the absolute values. This finding applied to all of the devices of the modern hematology systems. However, for hematology machines such as the Sysmex XE 5000, the absolute values were relatively reliable due to the high number of quantified cells. Thus, obtaining absolute cell numbers using these device systems is strongly recommended.
| Materials and Methods | ▴Top |
Complete cell counts were measured using the daily quality control checks (e-check (XE) and e-check (XS) 1, 2, and 3, with low, medium, and high controls, Streck-Sysmex) of the hematological analysis system XE 5000 of the company Sysmex (Sysmex, Kobe, Japan). Besides this, these systems consisted of image recognition systems (CellaVision) and manual blood counts.
The quality control checks were systematically evaluated. The mean and standard deviation of the absolute measurements were calculated, and the mean and standard deviation of the quotients (relative values) were also determined.
Second, a Gaussian error calculation was performed for the quotients.
Next, the theoretically determined error values (according to the Gaussian method) and the experimentally occurring errors were juxtaposed and compared with each other.
| Results | ▴Top |
Measurements of the controls
The analytical accuracy of the quotients was always higher compared with the analytical accuracy of absolute measurements. This finding applied to both the relative cell number in the blood counts of the optical image analysis using the CellaVision machine as well as the results obtained from the manually performed blood counts. In the case of the hematology machines, the accuracy of the absolute number, however, could be considered sufficient even if significantly lower than the accuracy of the quotients (or relative values). This finding was likely due to the high number (up to 10,000 cells) of cells processed using these recently developed machines.
Gaussian error calculation (law of error propagation)
The coefficient of variation (CV), the standard deviation divided by the mean value, is a close approximation of the mean relative error, which is the error divided by the measured value. In physics, it is common practice to calculate (or to estimate) the measurement error of the product or quotient of two measured quantities, according to the Gaussian error propagation equation, by means of the Pythagorean theorem (Fig. 1).
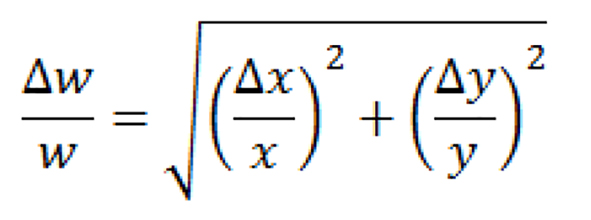 Click for large image | Figure 1. Pythagorean theorem. |
Measurement of the day-to-day precision control for the hematological parameters yielded a CV of 1.49% for the basophils at 12 Gpt/L (high level control e-check (XE) 3) and of 2.09% for the basophils at 1.76 Gpt/L (low level control e-check (XE) 1).
For the total cell count, a CV of 1.36% was observed at 29 Gpt (high level control e-check (XE) 3), and a CV of 1.79% was observed at 4.6 Gpt/L (low level control e-check (XE) 1). Thus, with values of < 1.76 Gpt/L for the basophils, the CV was approximately 2.1%, and for the total cell count, the CV was approximately 1.4-1.8% at the levels tested.
According to the Gaussian calculation, the errors of the products of basophils and the total cell count were 2.017% (high level 3) and 2.75% (low level 1). The errors of the basophil/total cell quotient were also 2.017% for the high level (level 3) and 2.75% for the low level (level 1).
Looking at the basophils
Comparison of the experimental determined measurement error of the quotients with the calculated measurement error according to the Gaussian error calculation (law of error propagation)
Thus, by looking at the XE5000 hematological analyzer of the company Sysmex (Symex, Kobe, Japan) and at the high level control (level 3), the experimental determined CV of < 0.56% for the basophil quotient (relative basophils cp. Table 1) was a strong improvement over the theoretical determined possible error of the basophils to total cell ratio of 2.017% (level 3).
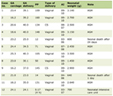 Click to view | Table 1. Imprecisions of Absolute and Relative Cell Counts Measured With the Sysmex XE5000 Hematological Analyzer (Control Material High Level Control Level 3) |
Furthermore, by looking at the low level control (level 1), the experimental determined CV of 1.45% for the basophil quotient (relative basophils) was also an improvement over the theoretical determined possible error of the basophils to total cells ratio of 2.75%.
Comparison of absolute and relative cell counts
Again looking at the basophils gave a CV of 1.49% for the imprecision of the absolute cell counts and a CV of only 0.56% for the imprecision of the relative cell counts. Thereby, control material e-check level 3 (Streck, Sysmex, Kobe, Japan) was measured day by day for 19 days. Absolute values were measured in Gpt/L (giga particle counts per liter) and relative values were reported as percentages. The same result was true for all other cellular parameters.
Evaluation of theoretical and experimental results
Thus, according to theoretical considerations as well as the Gaussian error calculation, the error of the basophil to total cell quotient should be significantly higher than the error of the absolute cell counts themselves. However, the experimental results revealed that the experimental errors of the cell quotients (relative cell ratios) were significantly lower than the errors of the absolute cell counts. The same effects as described for the basophils were in principle also seen for all other cell counts for all other leukocyte subtypes.
Figures 2 and 3 give the errors in basophils plotted versus the error in total cell counts. A linear relationship always shows up, indicating that the systematic or combined measurement error always is directed into the same direction. This type of error “cancels out” through quotient formation.
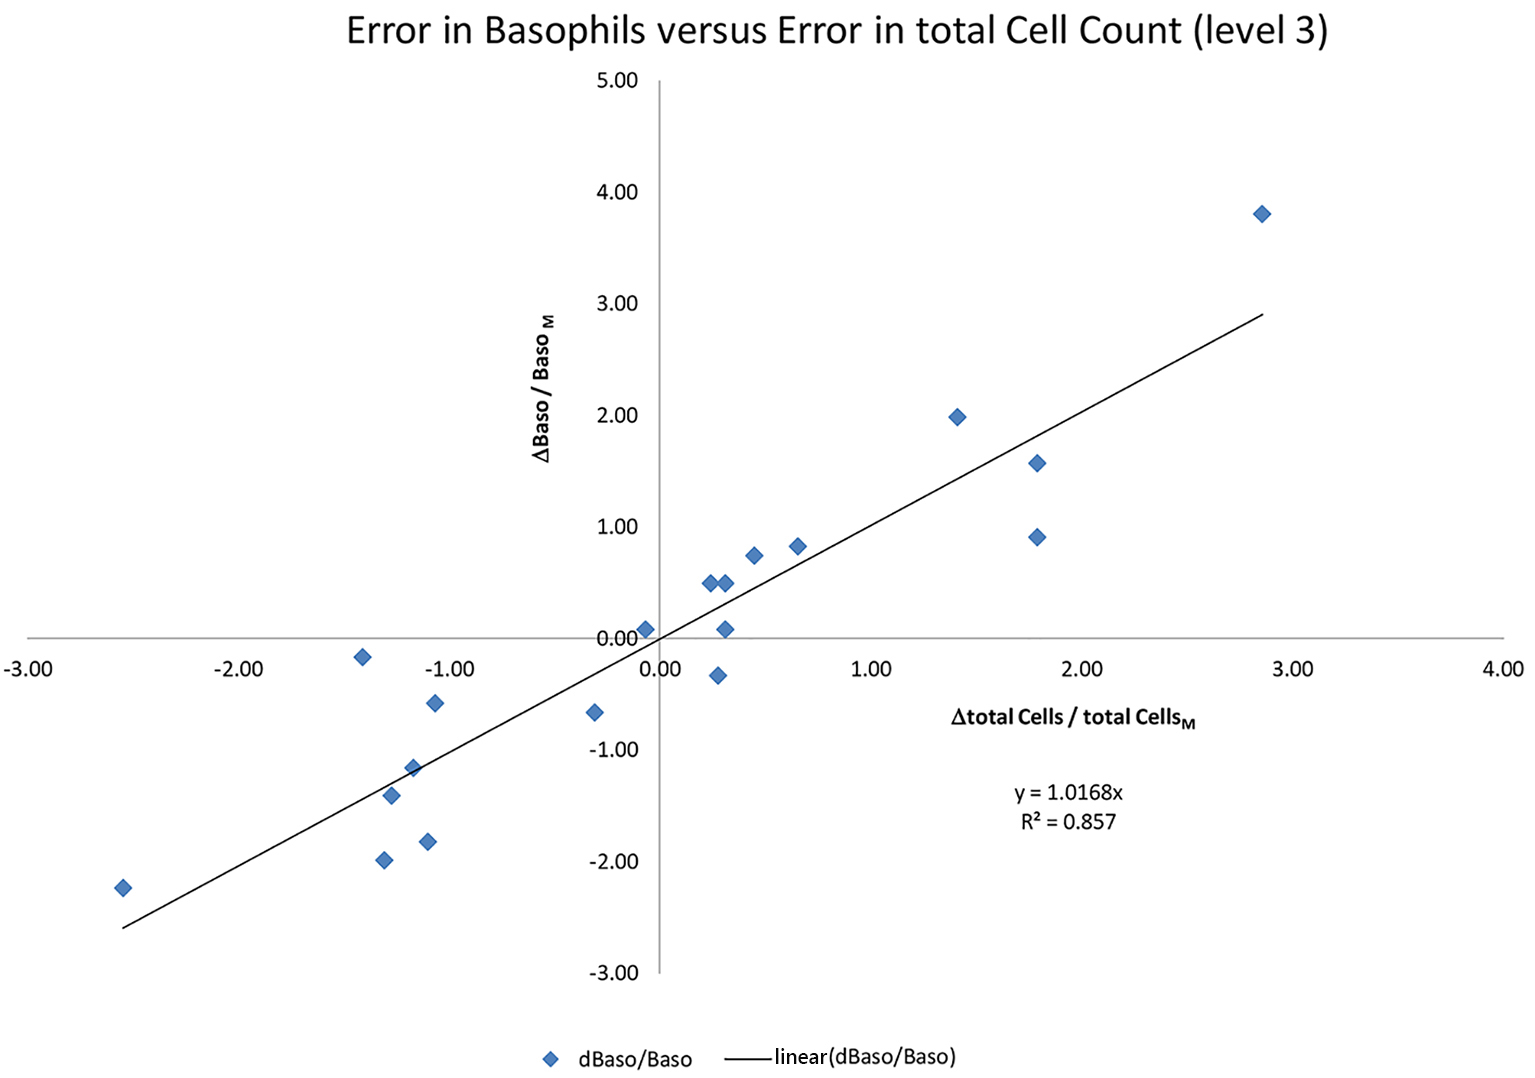 Click for large image | Figure 2. Error in the absolute basophil counts. This error is thereby proportional to the error in the total cell count (r = 0.8). E-check hematology quality control (QC level 3) is used on a Sysmex XE 5000 hematology analyzer. |
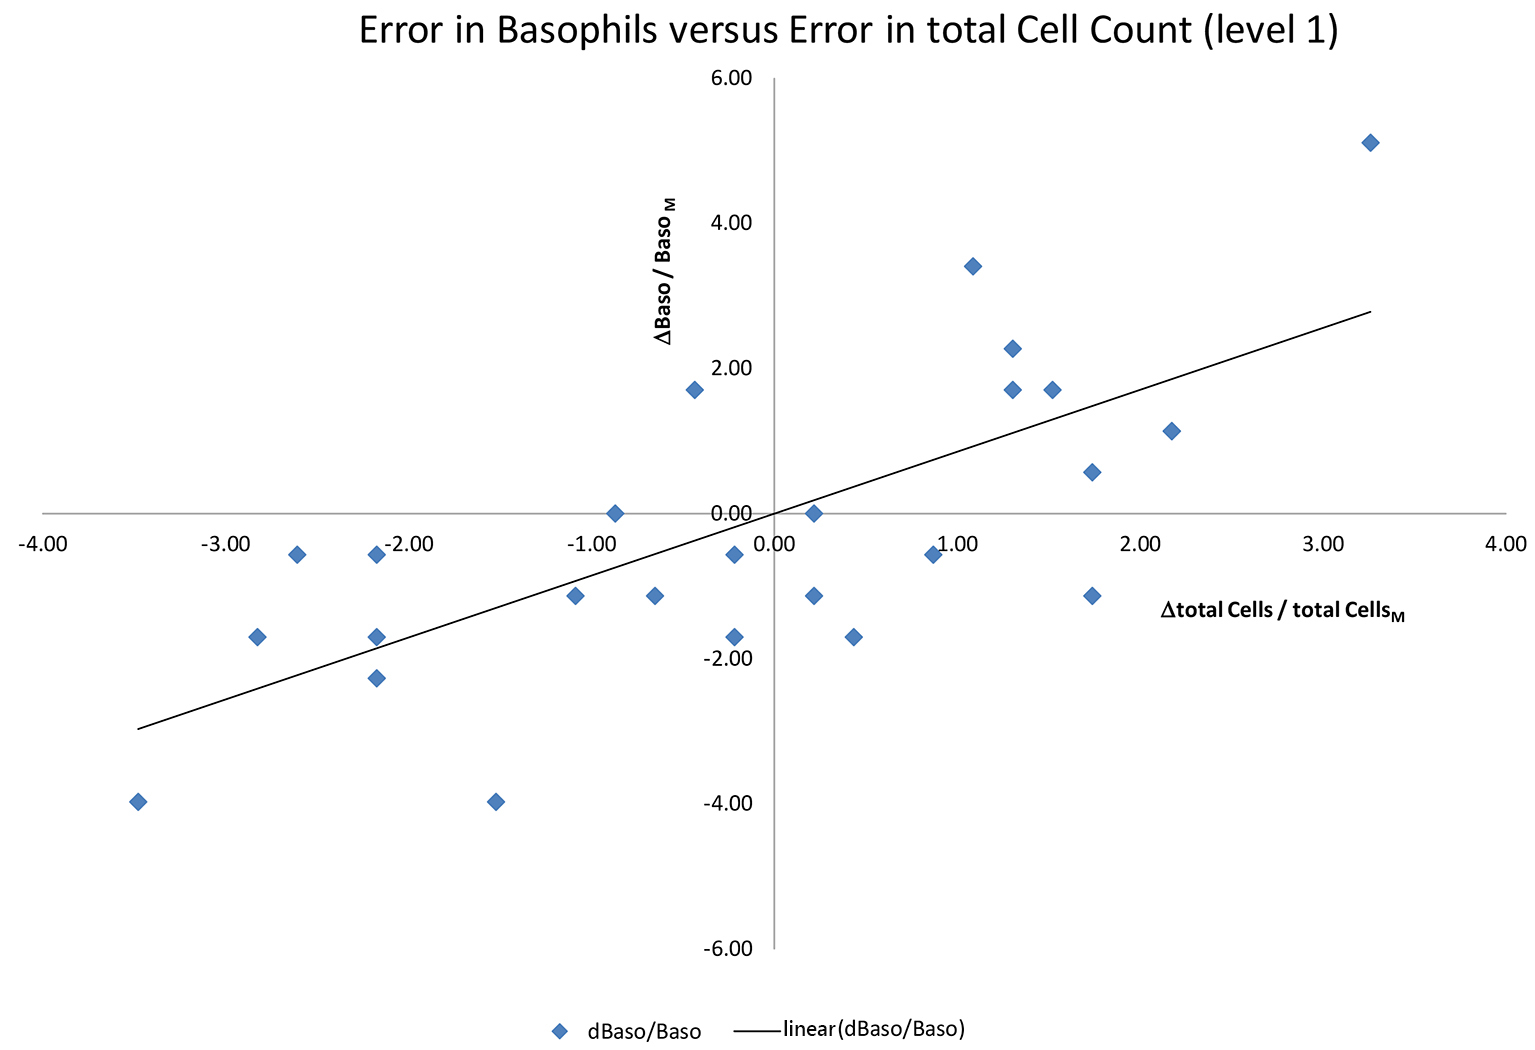 Click for large image | Figure 3. Error in the absolute basophil counts. This error is thereby proportional to the error in the total cell count. E-check hematology quality control (QC level 1) is used on a Sysmex XE 5000 hematology analyzer. |
The quotient or relative ratio of the basophils corresponds to the slope of the linear line in Figures 2 and 3. And the slope is always the same, independent from the systematic or combined measurement error underlying a single measurement.
The effect, as shown here for the basophils, was the same for all cellular parameters measured by the analyzer. For the machine cell counts, the effect on the basophils was the most prominent, but was also present for all other cell types. For relative cell counts, the measurement error (and the CVs) was always lower and the precision was always higher than for absolute cell counts.
| Discussion | ▴Top |
According to the results presented here (especially for manual differential blood counts and those obtained using pattern recognition machines as the CellaVision), the analytical accuracy of the ratios was significantly higher compared to the accuracy of the absolute cell count values for all manual and semi-manual quantification methods. Due to this fact, most labs only report the relative values for these manual methods. Contrary to this result, by using the Gaussian theory of errors, higher errors were estimated for the quotients (relative cell values) than for the absolute cell counts.
For the large hematology machines and differential blood cell counting machines, the results are in principal identical (lower imprecision of the relative values, higher imprecision of the absolute value); however, the measured absolute values are also acceptable accurate, due to a high number of cells counted by these machines.
In general, the measurement error can be divided into a systematic, a random and here so-called “combined error”. By quotient formation, we observed a reduction in the combined error, because several or all cellular parameters that are counted in one run are coupled. If the volume investigated in one run is higher, then all cellular parameters counted are counted higher. If the volume investigated in one run is lower, then all cellular parameters counted are counted lower. The same occurs if the blood portion is not well mixed. This “combined error” is reduced by quotient formation. Thereby, the combined error affects all cell populations measured in one run in the same way. This type of error seems to be directed always into the same direction for the leukocyte subtype and for the total cell count as well. Figure 2 indicates that the errors in the basophil cell counts and total cell counts are indeed in the same direction, so that they “cancel out” through quotient formation. The result is thus an error reduction through quotient formation when looking at relative cell counts. The same can be seen in Figure 3 for another quality control level. Thereby, both measurements (Figs. 2 and 3) belong to automated complete blood cell counts (company Sysmex XE5000, Sysmex, Kobe, Japan).
Acknowledgments
The author thanks to Ms Gotz, Ms Schorge and Ms Piwek for technical assistance and for their help with the hematological quality control data. Furthermore, the author thanks Dr. Martin Hintz for laboratory assistance and helpful discussions.
| References | ▴Top |
- Shewhart WA. Economic control of quality of manufactured product. New York Van Nostrand. 1931.
- Levey S, Jennings ER. The use of control charts in the clinical laboratory. Am J Clin Pathol. 1950;20(11):1059-1066.
pubmed - Westgard JO, Barry PL, Hunt MR, Groth T. A multi-rule Shewhart chart for quality control in clinical chemistry. Clin Chem. 1981;27(3):493-501.
pubmed - Westgard JO, Groth T, Aronsson T, Falk H, de Verdier CH. Performance characteristics of rules for internal quality control: probabilities for false rejection and error detection. Clin Chem. 1977;23(10):1857-1867.
pubmed - Westgard JO, Groth T. Power functions for statistical control rules. Clin Chem. 1979;25(6):863-869.
pubmed - Westgard JO, Groth T, Aronsson T, de Verdier CH. Combined Shewhart-cusum control chart for improved quality control in clinical chemistry. Clin Chem. 1977;23(10):1881-1887.
pubmed - Blum AS. Computer evaluation of statistical procedures, and a new quality-control statistical procedure. Clin Chem. 1985;31(2):206-212.
pubmed
This is an open-access article distributed under the terms of the Creative Commons Attribution-NonCommercial 4.0 International License, which permits unrestricted non-commercial use, distribution, and reproduction in any medium, provided the original work is properly cited.
Journal of Hematology is published by Elmer Press Inc.