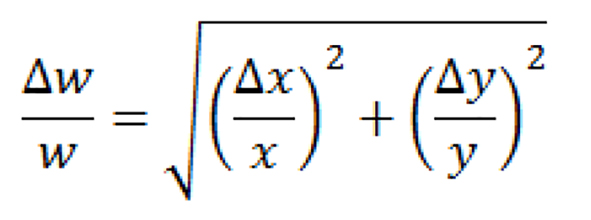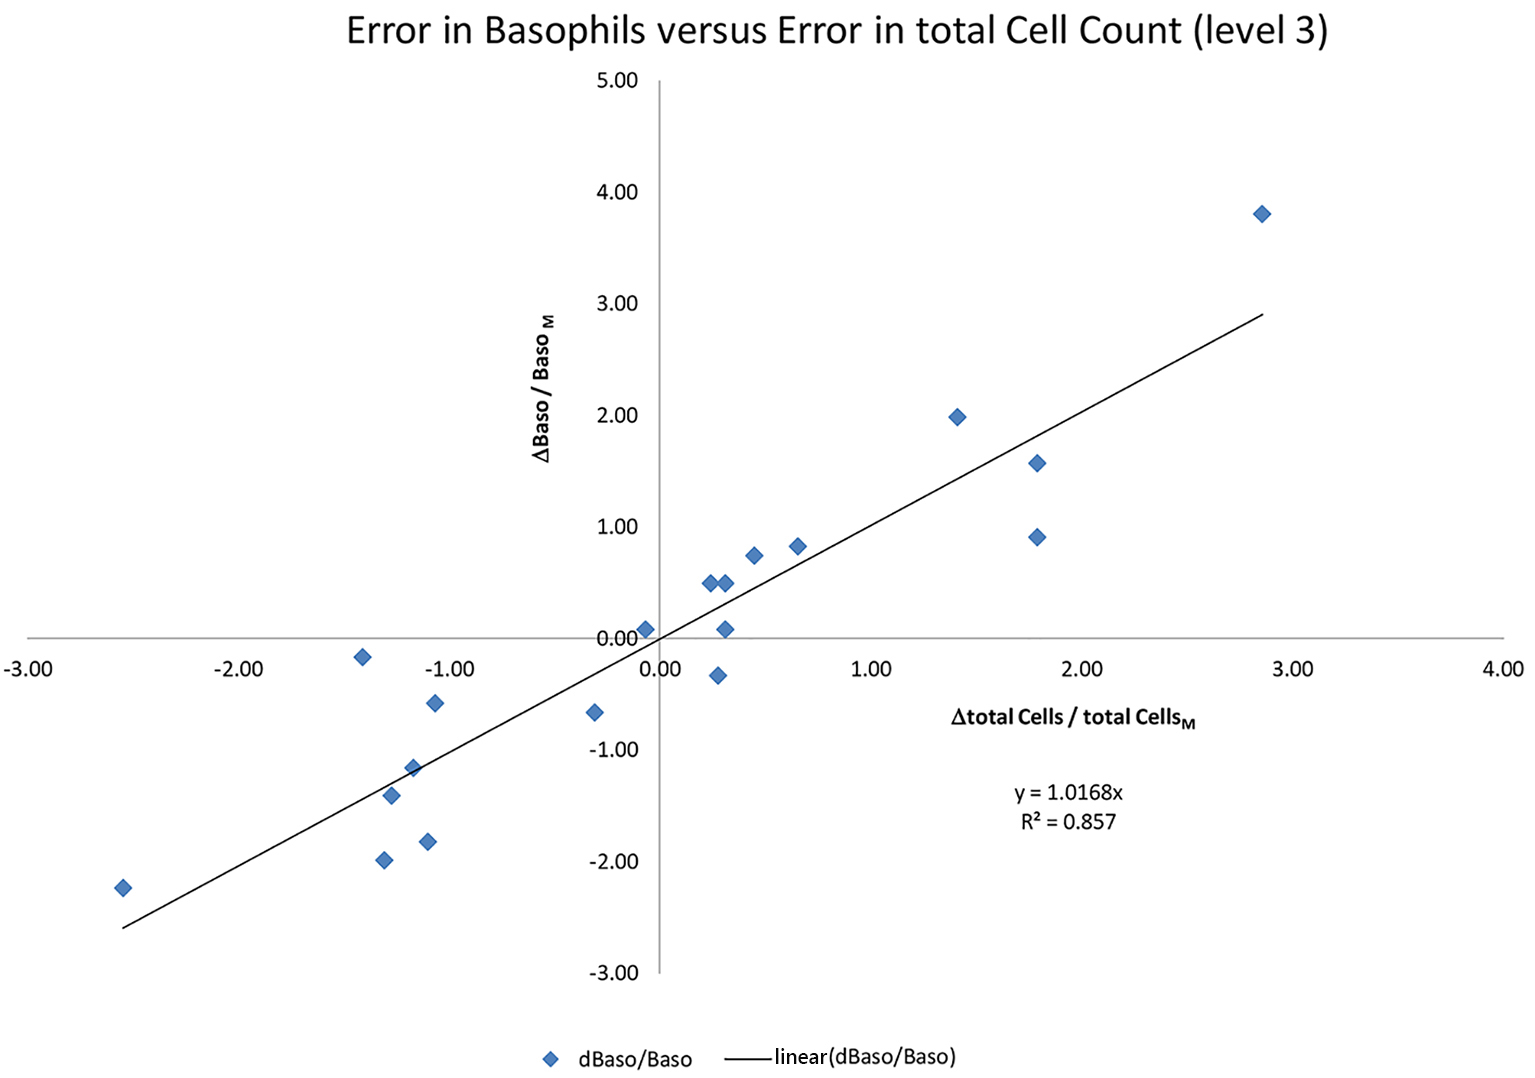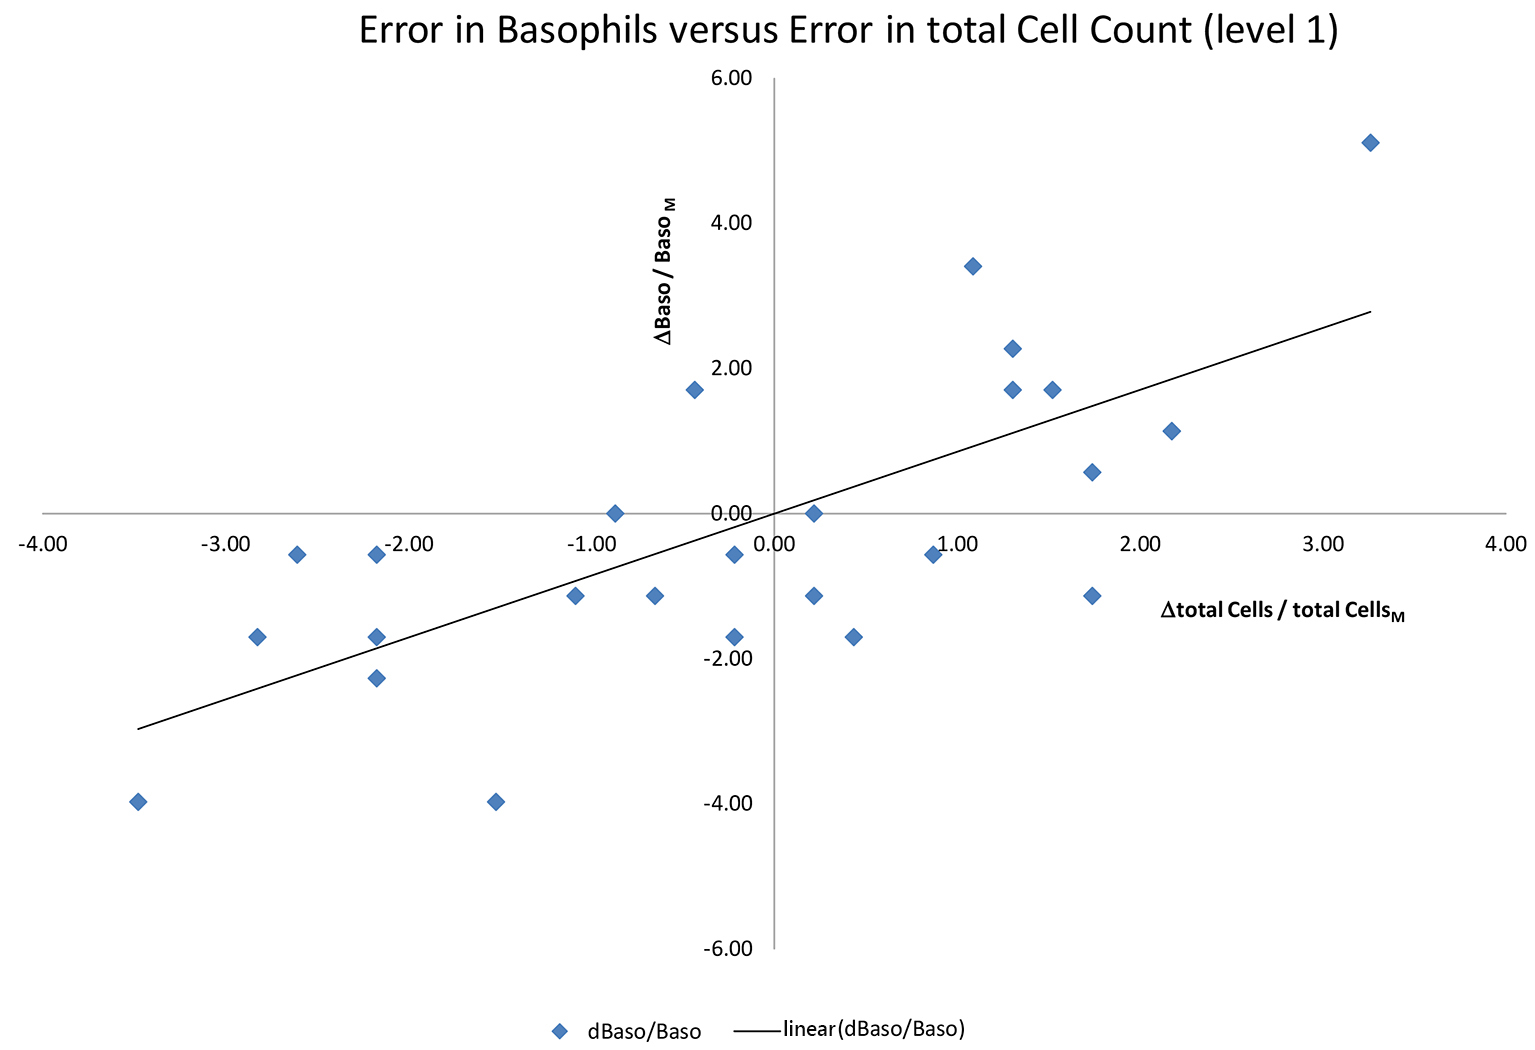
Figure 1. Pythagorean theorem.
| Journal of Hematology, ISSN 1927-1212 print, 1927-1220 online, Open Access |
| Article copyright, the authors; Journal compilation copyright, J Hematol and Elmer Press Inc |
| Journal website http://www.thejh.org |
Original Article
Volume 5, Number 2, June 2016, pages 49-53
Complete Blood Count: Absolute or Relative Values?
Figures


Table
| Cells | Mono abs. | Mono rel. (%) | Neutro abs. | Neutro. rel. (%) | Baso abs. | Baso rel. (%) | Eos abs. | Eos rel. (%) | Lymph. abs. | Lymph. rel. (%) | Cell-Sum |
|---|---|---|---|---|---|---|---|---|---|---|---|
| 1.58 | 5.50 | 8.57 | 29.83 | 11.86 | 41.28 | 1.88 | 6.54 | 4.84 | 16.85 | 28.73 | |
| 1.52 | 5.14 | 8.79 | 29.73 | 12.27 | 41.49 | 2.12 | 7.17 | 4.87 | 16.47 | 29.57 | |
| 1.72 | 5.94 | 8.69 | 30.01 | 12.00 | 41.44 | 1.80 | 6.22 | 4.75 | 16.40 | 28.96 | |
| 1.55 | 5.26 | 9.00 | 30.55 | 12.32 | 41.82 | 1.89 | 6.42 | 4.70 | 15.95 | 29.46 | |
| 1.42 | 4.86 | 8.72 | 29.82 | 12.18 | 41.66 | 2.09 | 7.15 | 4.83 | 16.52 | 29.24 | |
| 1.59 | 5.46 | 8.70 | 29.86 | 12.09 | 41.49 | 1.71 | 5.87 | 5.05 | 17.33 | 29.14 | |
| 1.38 | 4.74 | 8.96 | 30.76 | 12.04 | 41.33 | 1.80 | 6.18 | 4.95 | 16.99 | 29.13 | |
| 1.52 | 5.29 | 8.25 | 28.71 | 12.01 | 41.79 | 1.93 | 6.72 | 5.03 | 17.50 | 28.74 | |
| 1.54 | 5.37 | 8.60 | 30.00 | 11.84 | 41.30 | 2.00 | 6.98 | 4.69 | 16.36 | 28.67 | |
| 1.49 | 5.19 | 8.16 | 28.42 | 11.94 | 41.59 | 1.89 | 6.58 | 5.23 | 18.22 | 28.71 | |
| 1.35 | 4.77 | 8.48 | 29.95 | 11.81 | 41.72 | 1.86 | 6.57 | 4.81 | 16.99 | 28.31 | |
| 1.28 | 4.39 | 8.77 | 30.05 | 12.17 | 41.71 | 1.93 | 6.61 | 5.03 | 17.24 | 29.18 | |
| 1.39 | 4.79 | 8.50 | 29.28 | 12.09 | 41.65 | 1.97 | 6.79 | 5.08 | 17.50 | 29.03 | |
| 1.36 | 4.67 | 8.78 | 30.15 | 12.14 | 41.69 | 1.84 | 6.32 | 5.00 | 17.17 | 29.12 | |
| 1.38 | 4.74 | 8.78 | 30.13 | 12.14 | 41.66 | 1.84 | 6.31 | 5.00 | 17.16 | 29.14 | |
| 1.26 | 4.39 | 8.83 | 30.79 | 11.91 | 41.53 | 1.89 | 6.59 | 4.79 | 16.70 | 28.68 | |
| 1.64 | 5.55 | 8.97 | 30.33 | 12.19 | 41.22 | 1.77 | 5.99 | 5.00 | 16.91 | 29.57 | |
| 1.51 | 5.05 | 8.69 | 29.08 | 12.54 | 41.97 | 1.99 | 6.66 | 5.15 | 17.24 | 29.88 | |
| 1.34 | 4.68 | 8.40 | 29.33 | 12.06 | 42.11 | 1.98 | 6.91 | 4.86 | 16.97 | 28.64 | |
| Means | 1.46 | 5.04 | 8.67 | 29.83 | 12.08 | 41.60 | 1.90 | 6.56 | 4.93 | 16.97 | 29.05 |
| Standard variation | 0.13 | 0.42 | 0.23 | 0.63 | 0.18 | 0.23 | 0.10 | 0.36 | 0.15 | 0.51 | 0.39 |
| VK % | 8.58 | 8.33 | 2.65 | 2.13 | 1.49 | 0.56 | 5.51 | 5.47 | 3.08 | 3.02 | 1.36 |