

| Journal of Hematology, ISSN 1927-1212 print, 1927-1220 online, Open Access |
| Article copyright, the authors; Journal compilation copyright, J Hematol and Elmer Press Inc |
| Journal website http://www.thejh.org |
Original Article
Volume 7, Number 3, September 2018, pages 96-106
Cytokine Syntheses by T-Cell Subsets From Chronic Myeloid Leukemia Patients: Relationship Between Pre-Treatment Levels and Response to Imatinib Therapy
Inaam B. Hassana, b, e, Sheela Benedictc, Jorgen Kristensend
aDepartment of Internal Medicine, College of Medicine and Health Sciences, United Arab Emirates University, Al Ain, UAE
bDepartment of Oncology, Tawam Hospital, Al Ain, UAE
cFatima College of Health Sciences, Ajman, UAE
dMediclinic North Wing, Dubai, UAE
eCorresponding Author: Inaam Bashir Hassan, Department of Internal Medicine, College of Medicine and Health Sciences, United Arab Emirates University, PO Box 1766, Al Ain, UAE
Manuscript submitted May 24, 2018, accepted June 18, 2018
Short title: Cytokines in CML Pre- and During Imatinib
doi: https://doi.org/10.14740/jh410w
| Abstract | ▴Top |
Background: Although T-cell cytokine’s role in the long-term control of chronic myeloid leukemia (CML) is well established, previous studies showed contradicting results regarding imatinib (IM) effect on the endogenous T-cell function by IM. The purpose of this study was to determine the relation between the endogenous T-cell function prior to therapy and the degree of response to IM therapy in CP CML. In addition, modulation of the endogenous T-cell function during IM therapy was studied.
Methods: We evaluated Th1 (gamma interferon (IFN-γ)), Th2 (interleukin (IL-4)) and tumor necrosis factor (TNF)-α cytokine synthesis by activated T-cell subsets in 20 patients with newly diagnosed CML in chronic phase (CP CML) using flow cytometry before and during IM therapy compared to patients with IM resistance (IM Res) and healthy donors.
Results: Patients with optimal response (CML OR) to IM demonstrated a lower pre-treatment Th1 cytokine compared to that of healthy donors, and a higher percentage of Th2 and TNF-α producing T cells compared to that of healthy donors, non-optimal responders (CML nOR) and those with IM Res. A shift from Th2 profile to Th1 profile and initial decline of TNF-α producing T cells was detected early during therapy in optimal responders which was coinciding with complete hematological remission with a significant increase in the percentages of CD4+ve/IFN-γ+ve cells (P = 0.01) and a significant drop of in CD8+ve/IL-4+ve T cells (P = 0.04).
Conclusion: We believe that pre-treatment levels of IL-4 and/or TNF-α may have a role in identifying CP CML patients who may respond to IM therapy; however, further investigation is needed.
Keywords: CML; Imatinib; T-cell subsets; Th1 cytokines; Th2 cytokine; Optimal versus non-optimal responder
| Introduction | ▴Top |
Chronic myeloid leukemia (CML) is a hematopoietic stem cell disorder with a clonal expansion of cells with cytogenetic abnormality identified with a reciprocal translocation between chromosome 9 and 22 [1] resulting BCR/ABL hybrid gene encoding for an abnormal fusion protein with activation tyrosine kinase activity. Immune response in particular T-cell response plays an important role in the development and long-term control of CML which was supported by the successful induction of CR in patient with molecular relapse of CML post-allogeneic stem cell transplant (allo-SCT) when using donor lymphocyte infusion (DLI) [2-4] This in addition to the high incidence of reported relapses following T-cell depletion of allografts [5]. However, data regarding the immune response of autologous T-cell from CML patients were contradicting. Some of the published data reported: 1) decreased in percentage Th1 and tumor necrosis factor (TNF)-α but increase in percentage of Th2 cytokine producing T cells [6-8]; 2) decreased in percentage of Th1 and TNF-α but comparable Th2 percentage of cytokine producing T cells [9]; or 3) decrease in percentage of both Th1 And Th2 of cytokine producing T cells from patients with untreated chronic phase CML [10, 11]. Although Kiani et al [12] reported normal intrinsic Th1/Th2 balance secreted from purified CD4 T cells from patients with CP CML, they ruled out the presence of intrinsic T-cell defects. The role of the leukemia or accessory cells was not clear as the same study showed lower Th1 and enhanced Th2 (interleukin (IL)-10) cytokine production by T cells when stimulated within the mononuclear cell fraction from chronic phase CML patients.
Imatinib (IM) is a tyrosine kinase inhibitor that induces complete hematological (CHR) and cytogenetic (CCgR) remission [13, 14] in a considerable number of chronic phase CML patients. However, fewer patients achieve major or complete molecular remission [15] which has been proved to be major predictors of a durable cytogenetic remission [16, 17] as well as of a better probability of disease free survival. The main limitations to IM therapy are suboptimal response or loss of an initial response. The mechanisms of IM resistance are either BCR/ABL related or unrelated [18, 19]. Although restoration of the synthesis of Th1 cytokines in patients who achieved CCgR during interferon (IFN)-α and after discontinuation of the treatment compared to those who did not achieve CCgR was reported, contradicting results are published regarding the effect of IM on T-cell function from CML patients or healthy individuals. Some studies demonstrated an increased IFN-γ and TNF-α synthesis by T cell during IM therapy [8, 20], other studies reported suppression of cytokine synthesis including IFN-γ, IL-2 and TNF-α following activation of the T cells in whole blood [21, 22] or in vitro inhibition of antigen-specific T-cell (both CD4 and CD8) function by IM in a dose-dependent manner [23]. Furthermore, IM was shown to decrease expression of immunogenic antigens on CML cells resulting in decrease in CML-specific cytotoxic T lymphocyte (CTL) response [19] and while it was reported to impair the function and maturation of dendritic cells (DCs) differentiated from non-malignant CD34+ [24, 25], IM was found to activate DCs derived from peripheral blood mononuclear cells (PBMCs) from CML patients [26, 27].
In the present study, we evaluated the status of the immune compartment represented by the endogenous T-cell function (synthesis of Th1 and Th2 cytokines) in IM naive CP CML patients. The correlation between immune status at diagnosis and the degree of response to IM therapy (optimal or not optimal) was studied. In addition, the immune-modularity effect of IM therapy in CP CML patients was studied compared with immune status at diagnosis, that of normal controls and patients with known resistance to IM therapy.
| Materials and Methods | ▴Top |
In a non-randomized study, patients with newly diagnosed IM naive Ph-positive CP CML were recruited from the Department of Oncology, Tawam Hospital in Al Ain, UAE. Twenty patients who were eligible for treatment with IM and after signing an informed written consent were included in this study. Peripheral blood (PB) was collected from patients with CML at diagnosis or immediately before starting IM treatment and during treatment at 6 weeks, 3, 6 and 9 months. In addition, PB samples were taken from 10 healthy adults and from 5 patients with no response to IM therapy (IM Res). Samples were analyzed for synthesis of Th1 and Th2 cytokines by flow cytometery. For immune response, patients with at least one sample during treatment were included in the analysis. Clinical and follow-up data were obtained from patient hospital records. The study was approved by the Al Ain Medical District Human Research Ethics Committee.
Study of intracellular cytokine synthesis by T-cell subsets after activation with phorbol myristate acetate (PMA)
After obtaining an informed consent from each patient and control, 5 mL of heparinized peripheral venous blood was obtained from 20 patients with CP CML before starting IM therapy, 5 patients with IM Res and 10 control subjects for the purpose of measuring the synthesis of type 1 and type 2 cytokines by T-cell (CD3+ve cells) subsets (CD8+ve and CD8_ve). Blood from patients with white blood cell (WBC) count >15 × 103/µL was diluted to 10 × 103/µL to bring WBCs within normal range. The protocol was designed for three-color staining of cytokine producing cells using a CD3-PerCP/CD8 FITC/anticytokine-PE staining procedure. The examination of intracellular cytokine synthesis was conducted in three stages as described previously [28] briefly:
Activation of T cells by PMA
Whole blood of 1 mL was activated at 3 °C in a 5% CO2 incubator with 25 ng of PMA. The mixture was incubated for 4 h in the presence of 1 µg of ionomycin and 10 µg of brefeldin-A (a non-toxic but potent inhibitor of intracellular transport). Red blood cells were lysed with pharmlyse buffer. All reagents were purchased from Sigma Chemical Co (St Louis, MO, USA).
Staining of the activated T cells
After two washes with Perm/Wash buffer, the activated cells were divided between two sets of tubes. The cells were stained with anti-CD3-PerCP and anti-CD8-FITC to determine the surface immune phenotype of the T cells as CD8+ve and CD8-ve (or CD4+ve) T-cells. The stained cells were then treated with Cytofix/Cytoperm for 20 min at 4°C to allow penetration of cytokine-specific monoclonal antibody including PE-conjugated anti-IL-4, IFN-γ or TNF-α and hence permitted the identification of subsets of CD3+ve T cells that synthesized either of these cytokines. In parallel tubes, blood from each subject was incubated with brefeldin A (BFA) alone and served as an un-stimulated control. Stained cell preparations were fixed in a solution of 1% paraformaldehyde and analyzed immediately or stored at 4°C for analysis within 24 h.
Flow cytometric analysis of cytokines in the cytoplasm of activated T cells
Cell preparations of PMA-activated cells were analyzed with the FACScan flow cytometer (Becton Dickinson) using the CellQuest software. The analysis was performed by gating on CD3+ cells. A total of 10,000 events were acquired. Cytokine synthesis by the two T-cell subsets (CD3+ve/CD8+ve/CD4-ve and CD3+ve/CD8-ve/CD4+ve) were measured based on surface staining of the lymphocytes with anti-CD8. Forward scatter, side scatter and the three fluorescence parameters were saved in list-mode multi-parameter data files. Data were analyzed using the CellQuest software program (BD). Isotype controls were used to delineate positive and negative populations and to verify the staining specificity of the anti-cytokine reagents. The following reagents were obtained from Becton Dickinson: Pharm Lyse, Cell Fix, Perm/Wash buffer, Cytofix/Cytoperm, antiCD8-FITC, antiCD3-PerCP, isotype control, anti-human IFN-γ, PE anti-human IL4-PE and ani-human TNF-α PE. PMA, ponomycin and brefeldin A were purchased from Sigma and the RPMI used in this study was obtained from Gibco.
Response
Response is defined according to the published response criteria from leukamiaNet (Baccarani M 2006). Optimal response is defined as CHR and at least minor cytogenetic response (minor CgR) at 3 months, CCgR at 12 months and major molecular response (MMolR) at 18 months. Treatment failure is defined as less than CHR at 3 months, less than partial cytogenetic response (PCgR) at 12 months or less than CCgR at 18 months. Suboptimal response is defined as incomplete hematological response at 3 months, less than CCgR at 12 months and less than MMolR at 18 months
Statistical analysis
The mean percentages ± standard error of the mean (SE) of T-cell subsets synthesizing the cytokines of interest were obtained for each sample. Data are presented as high-low plots of the mean percentages ± SE of CD8+ve and CD4+ve T cells/µL synthesizing a cytokine. Statistical differences between study groups with respect to the percentages of T cells synthesizing cytokines were determined by the Mann-Whitney test. A P value < 0.05 was considered to be statistical significant. All P values were two-tailed. All statistical analysis was performed using the IBM SPSS statistics 19.0.
| Results | ▴Top |
Patient’s characteristics
A total of 20 CP CML patients were included in this study. They were of heterogeneous ethnic backgrounds (Southeast Asian = 9, Filipino = 5 and Arabs = 6), 12 (60%) were male and 8 (40%) were females. Median age at diagnosis was 37 years (26 - 70 years). Twelve of the 20 patients were younger than 40 years of age and only one patient was > 60 years of age. Mean WBC count at diagnosis was 196.0 × 10⁹/L (28 × 109 – 638 × 109/L) with WBC > 50 × 109/L in 18/20 patients. Mean platelet count at diagnosis was 670 × 109/L (115 × 109/L – 1,394 × 109/L). Mean blast cell percentage was 2.6 (0-5%). Mean spleen size was 13.7 cm (5 - 22 cm). All patients received treatment with hydroxyurea prior to start of IM therapy (Table 1).
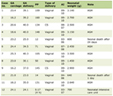 Click to view | Table 1. Characteristics of Chronic Phase Chronic Myeloid Leukemia (CP CML) Patients Included in the Study |
Th1 and Th2 cytokines synthesis by T-cell subsets from CP CML patients compared with that of normal control and patients with known IM Res
Flow cytometry analysis of intracellular Th1 and Th2 cytokines synthesis by T-cell (CD3+ve) subsets (CD8+ve and CD8-ve) was carried out on samples from 15 CML patients in CP prior to IM exposure (samples from five patients were not analyzed as their T-cell recovery after dilution was not adequate for analysis), 10 normal controls and 5 patients known to have IM Res. Results will be presented for each subset of CD3+ T cell separately.
CD3+ve/CD8-ve (CD4+ve)
Results are presented in Figure 1. Although the mean percentages of CD4+ve/IFN-γ+ve T lymphocytes following activation by PMA were lower in pre-treatment samples from CP CML patients as well as samples from patients with IM Res compared to normal controls, the differences were not statistically significant (Fig. 1a). We found comparable mean percentages of CD4+ve/TNF-α+ve T cells in CP CML patients and normal controls (P = 1.00) (Fig. 1c). On the other hand, there was a significantly lower mean percentage of CD4+ve/TNF-α+ve T cells observed in patients with IM Res compared to that of normal controls and CP CML patients (P = 0.019 and P = 0.025, respectively). Higher mean percentages of CD4+ve/IL-4+ve T cells were found in CP CML patients compared to normal controls and patients with IM Res; however, the differences were not statistically significant (Fig. 1e).
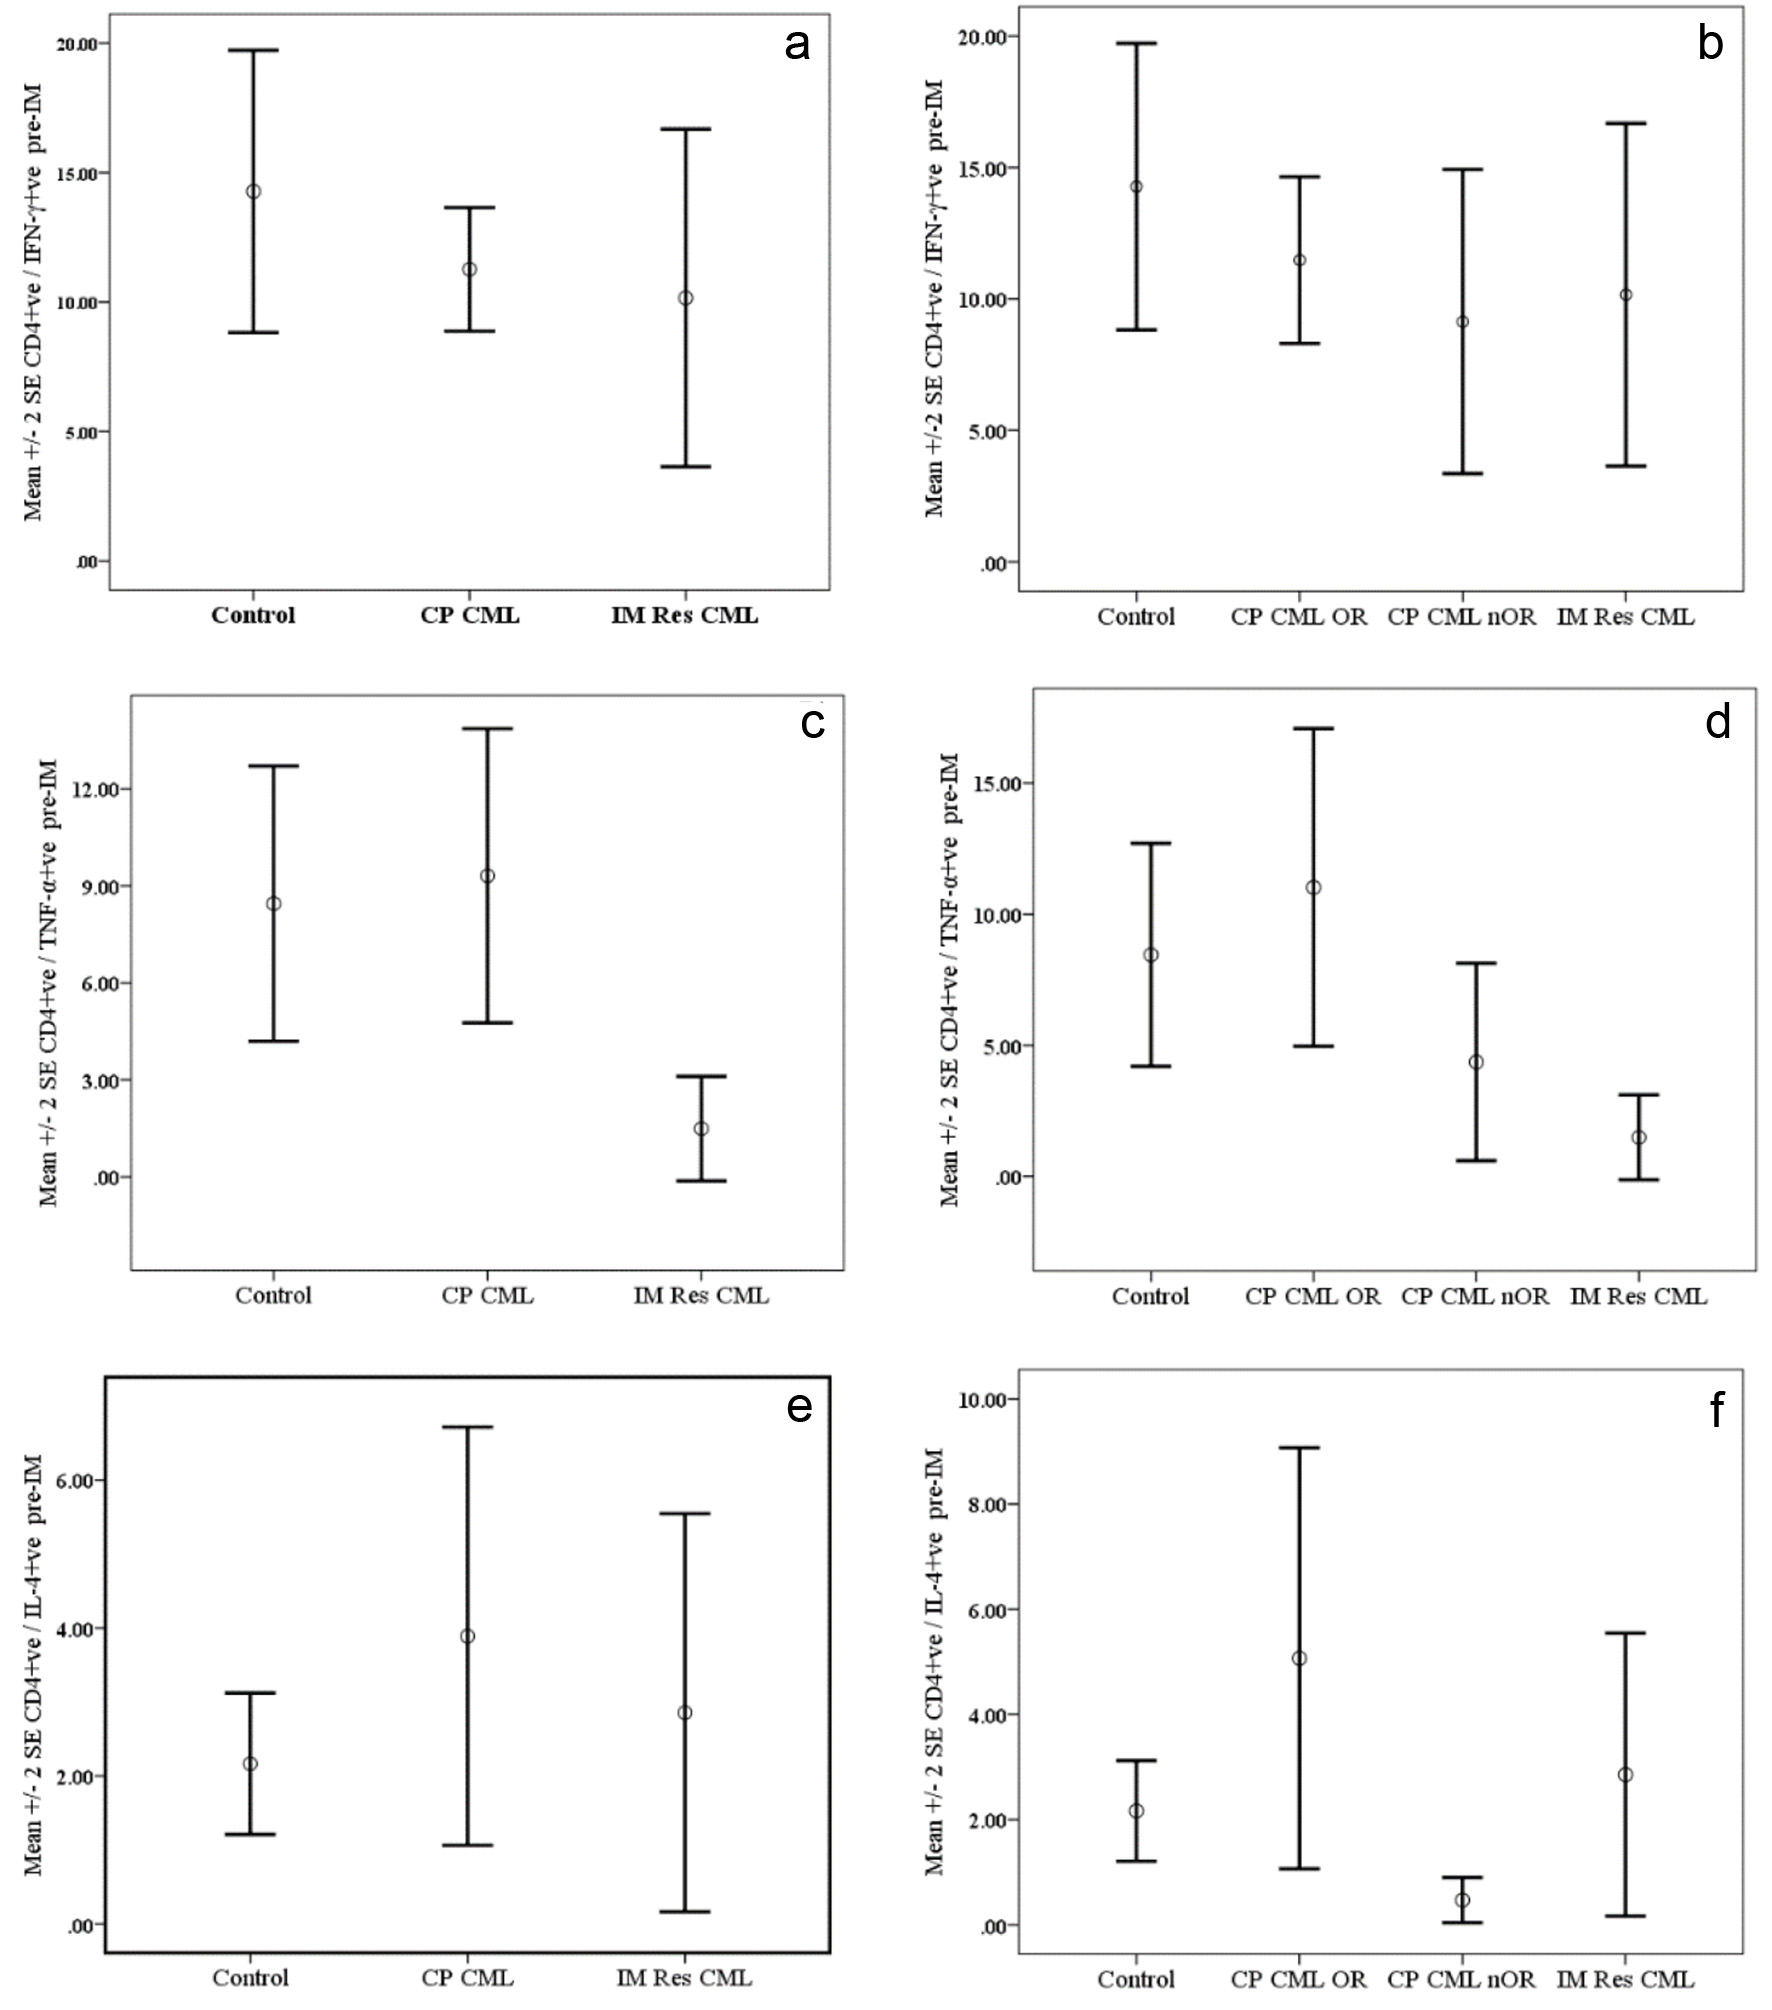 Click for large image | Figure 1. Cytokine synthesis by PMA-activated CD4+ve T cells from chronic phase CML (CP CM) patients pre-Imatinib therapy compared with normal controls and patients with resistance to Imatinib therapy (IM Res CML). Data are presented as mean percentages ± SEM. Data are presented as mean percentages ± SEM. a (IFN-ã), c (TNF-á) and e (IL-4) represent data for CP CM patients regardless of their response to therapy, while b (IFN-ã), d (TNF-á) and f (IL-4) represent data CP CM patients grouped according to their response to IM therapy. OR: optimal response; nOR: no optimal response. |
CD3+ve/CD8+ve (CD8+ve)
Results are presented in Figure 2. The mean percentages of CD8+ve/IFN-γ+ve T lymphocytes following activation by PMA were lower in pre-treatment samples from CP CML patients as well as samples from patients with IM Res compared to normal controls. However, the differences were not statistically significant (Fig. 2a). A trend for a higher mean percentage of CD8+ve/TNF-α+ve T cells was found in CP CML patients compared to controls with a near significance (P = 0.059) level and reaching a statistically significant level when compared with IM Res patients (p=0.005). On the other hand there was a significantly lower mean percentage of CD8+ve/TNF-α+ve T-cells observed in patients with IM Res compared to that of normal controls (P = 0.019) (Fig. 2c). Although higher mean percentages of CD8+ve/IL-4+ve T cells were found in CP CML patients compared to normal controls and patients with IM Res, the difference was only significant when CP CML compared to IM Res (P = 0.015) (Fig. 2e).
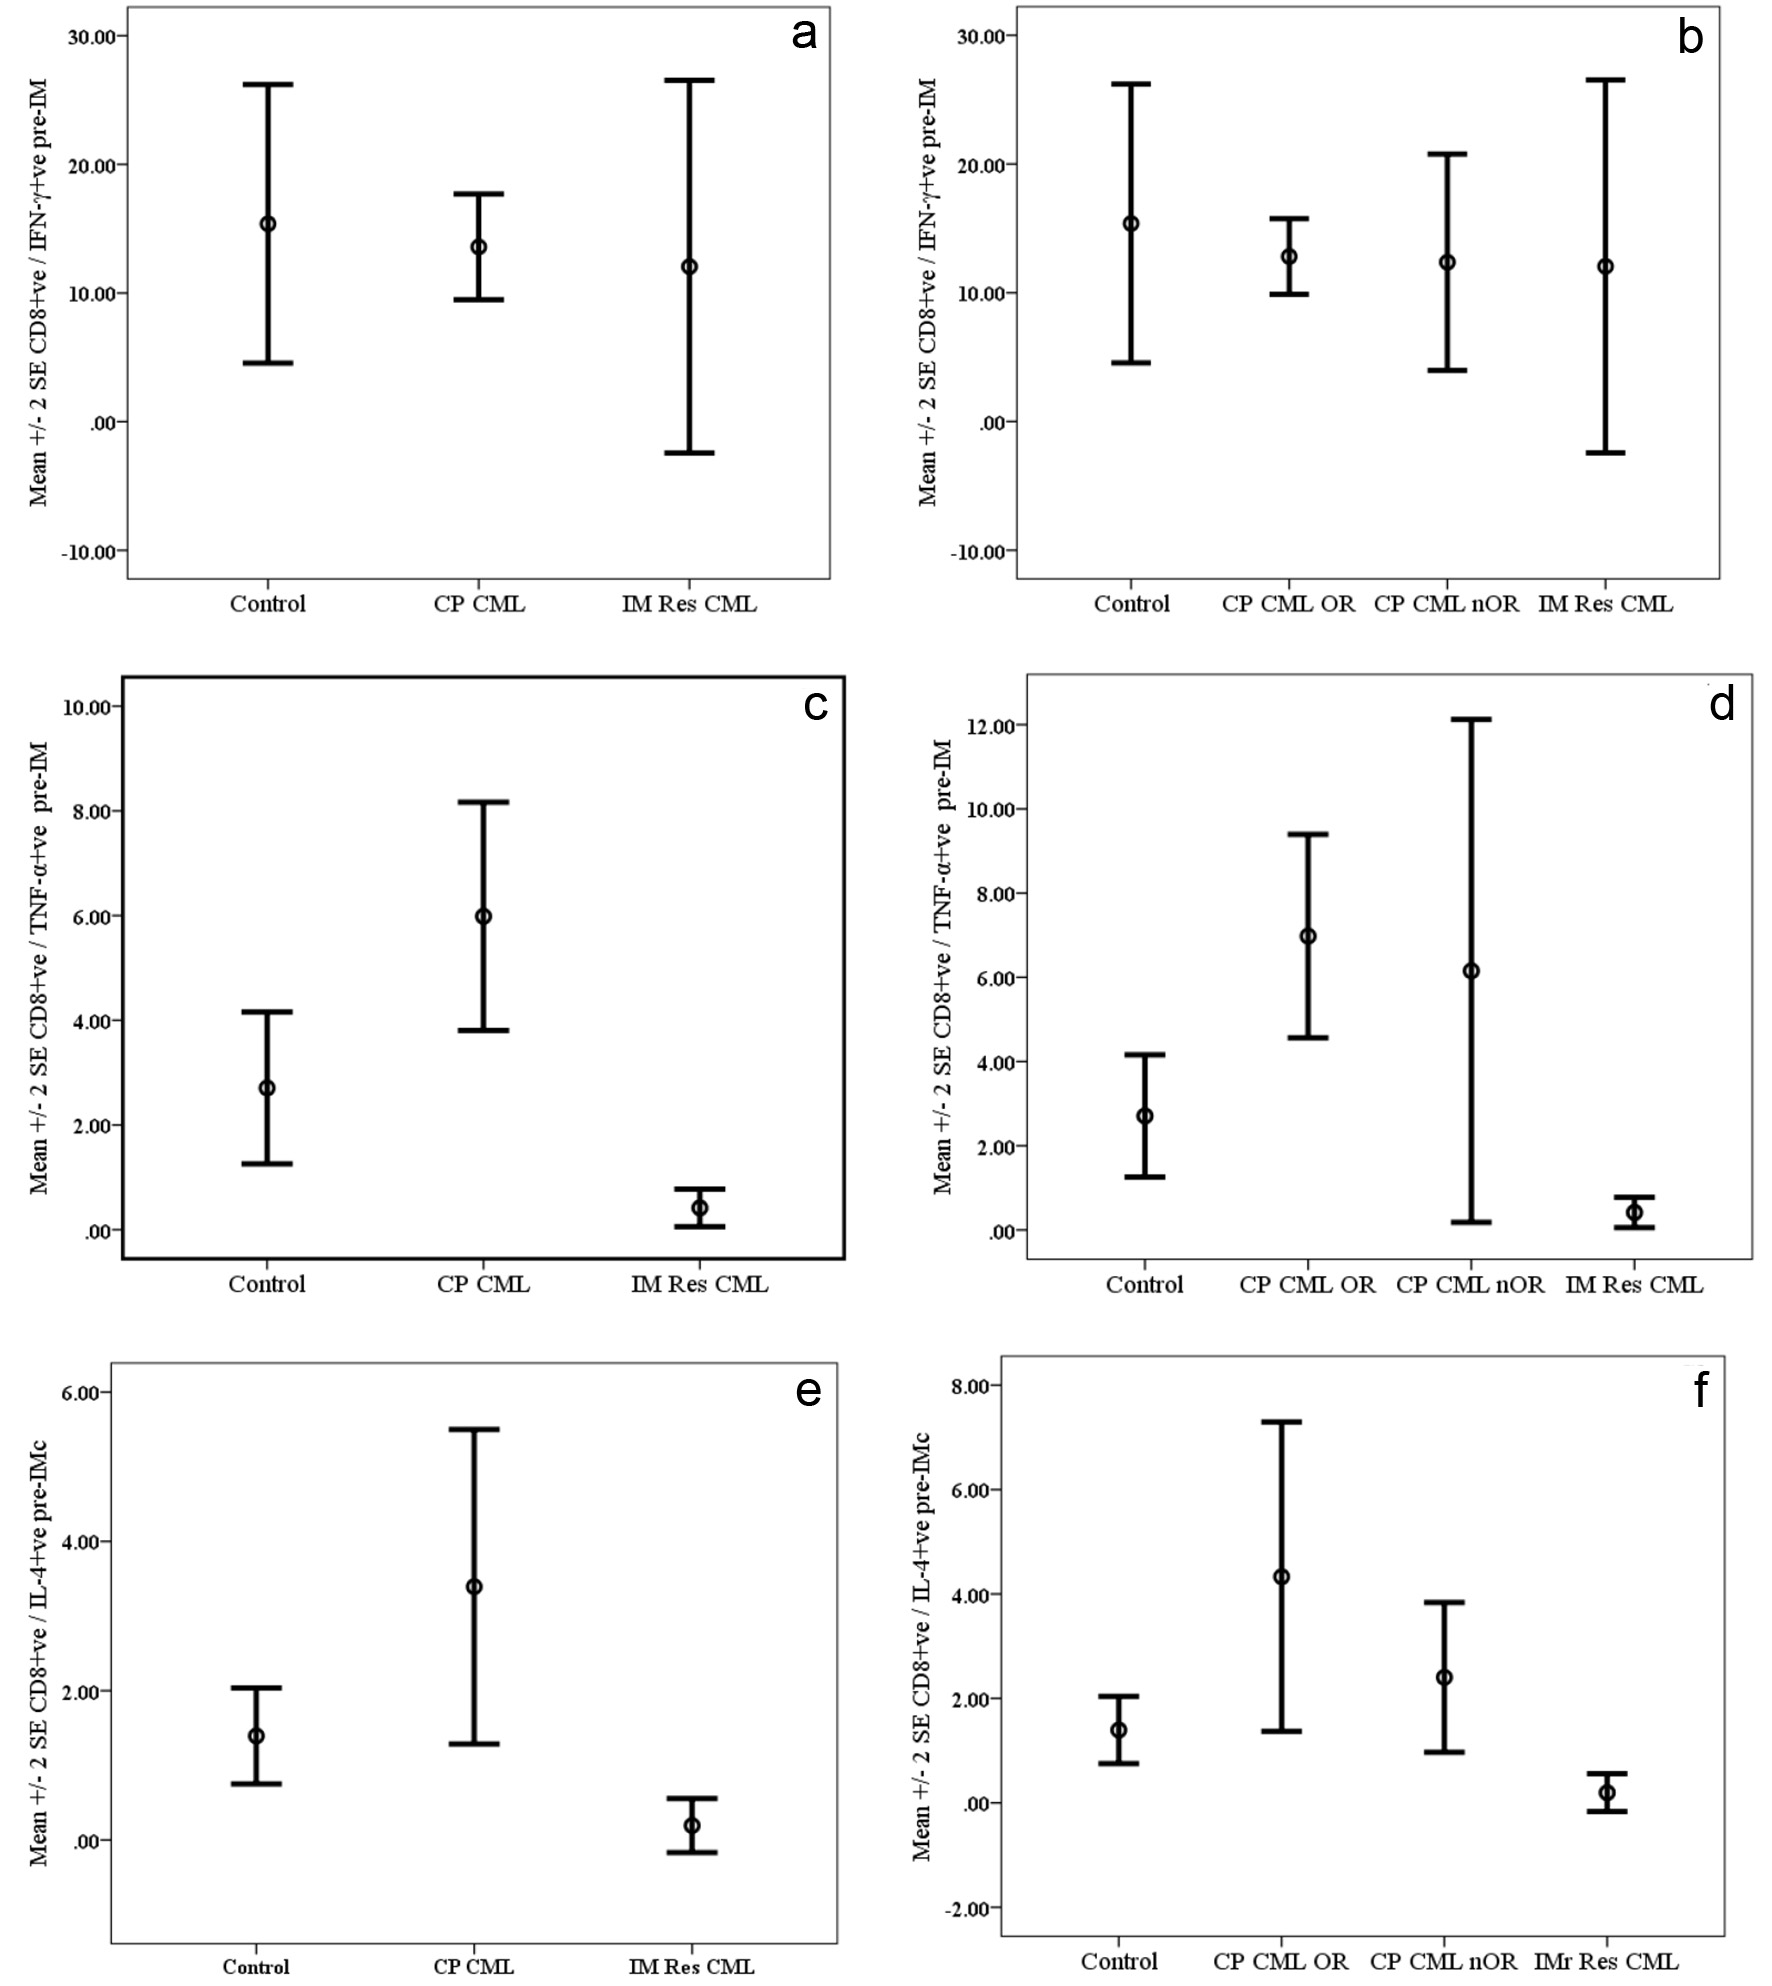 Click for large image | Figure 2. Cytokine synthesis by PMA-activated CD8+ve T cells from chronic phase CML (CP CML) patients pre-Imatinib therapy compared with normal controls and patients with resistance to Imatinib therapy (IM Res CML). Data are presented as mean percentages ± SEM. a (IFN-ã), c (TNF-á) and e (IL-4) represent data for CP CML patients regardless of their response to therapy, while b (IFN-ã), d (TNF-á) and f (IL-4) represent data CP CML patients grouped according to their response to IM therapy. OR: optimal response; nOR: no optimal response. |
Pre-IM Th1 & Th2 cytokines status of CP CML patient subgrouped according to their response to IM therapy into optimal responders (CP CML OR) and of non-optimal responder (CP CML nOR)
A trend for higher mean percentages of CD4+ve/IFN-γ+ve and CD8+ve/IFN-γ+ve T cells (Fig. 1b & 2b) in CP CML OR compared to that of CP CML nOR and IM Res patients; however, the differences were not statistically significant. The mean percentages of CD4+ve/TNF-α+ve and CD8+ve/TNF-α+ve T cells (Fig. 1d & 2d) from CP CML OR patient were significantly higher compared to IM Res patient (P = 0.013 and P = 0.003, respectively). On the other hand, the difference was only significant for CD8+ve/TNF-α+ve T cells from CP CML OR when compared with normal control (P = 0.011). Neither the mean differences between CP CML nOR and IM Res nor between CP CML OR and CP CML nOR were significant with regards to both T-cell subsets. A higher mean percentage of CD4+ve/IL-4+ve T cells (Fig. 1f) were found among activated T cells from CP CML OR patients compared to IM Res patients and CP CML nOR; however, the difference failed to reach statistically significant level (P = 0.44 and P = 0.077, respectively). Regarding CD8+ve/IL-4+ve T cells (Fig. 2f), significantly higher percentages were found among CP CML OR as well as among CP CML nOR when compared to IM Res (P = 0.019 and P = 0.036, respectively).
Response to IM therapy
Hematological response
All patients (20/20) achieved CHR by 12 weeks of treatment; of them 15/20 patients were already in CHR at 6 weeks of treatment. Five patients had cytopenia (leukopenia or thrombocytopenia) requiring dose reduction and or administration of granulocyte-colony stimulating factor (G-CSF).
Overall response
At 1 year or at the last follow-up, 15/20 patients had optimal response (CHR, CcyR with/or without MMR). Three of the 20 patients did not have optimal response although they were in CHR at 1 year and they had only PCgR with 1 log reduction of transcripts. One of them has complex karyotype with t(6:9:22), had major Cy response at 1 year but disease progression at 18 months, switched to nilotinib resulting in CCR at 6 month of therapy. The second patient had dose reduction of IM due to cytopenia and although he maintained CHR with G-CSF and erythropoietin support, he had a positive 45% fluorescence in situ hybridization (FISH) at 18-month follow-up and switch to dasatinib with resulting cytopenia. The third patient lost the response with disease progression and did not respond to any thymidine kinase (TK) therapy. Two of the 20 patients were lost to follow-up as they left the UAE.
Cytokine response
1) IFN-γ
An increase in the mean percentage of CD4+ve/IFN-γ+ve and CD8+ve/IFN-γ+ve synthesizing T cells was detected at 6 weeks of treatment with levels exceeding that of normal controls. This increase was significantly higher for CD4+ve/IFN-γ+ve T cells when compared to their pre-treatment level (P = 0.011) and although it was followed by a decline at 3 months, the levels were comparable to that of the normal controls and still higher than the pre-treatment levels (Fig. 3a). For CD8+ve/IFN-γ+ve T cells, the difference between pre- and post-treatment levels was not statistically significant, but was maintained at levels exceeding that of normal controls for more than 3 months of treatment before declining to levels lower than that of the normal controls (Fig. 3b).
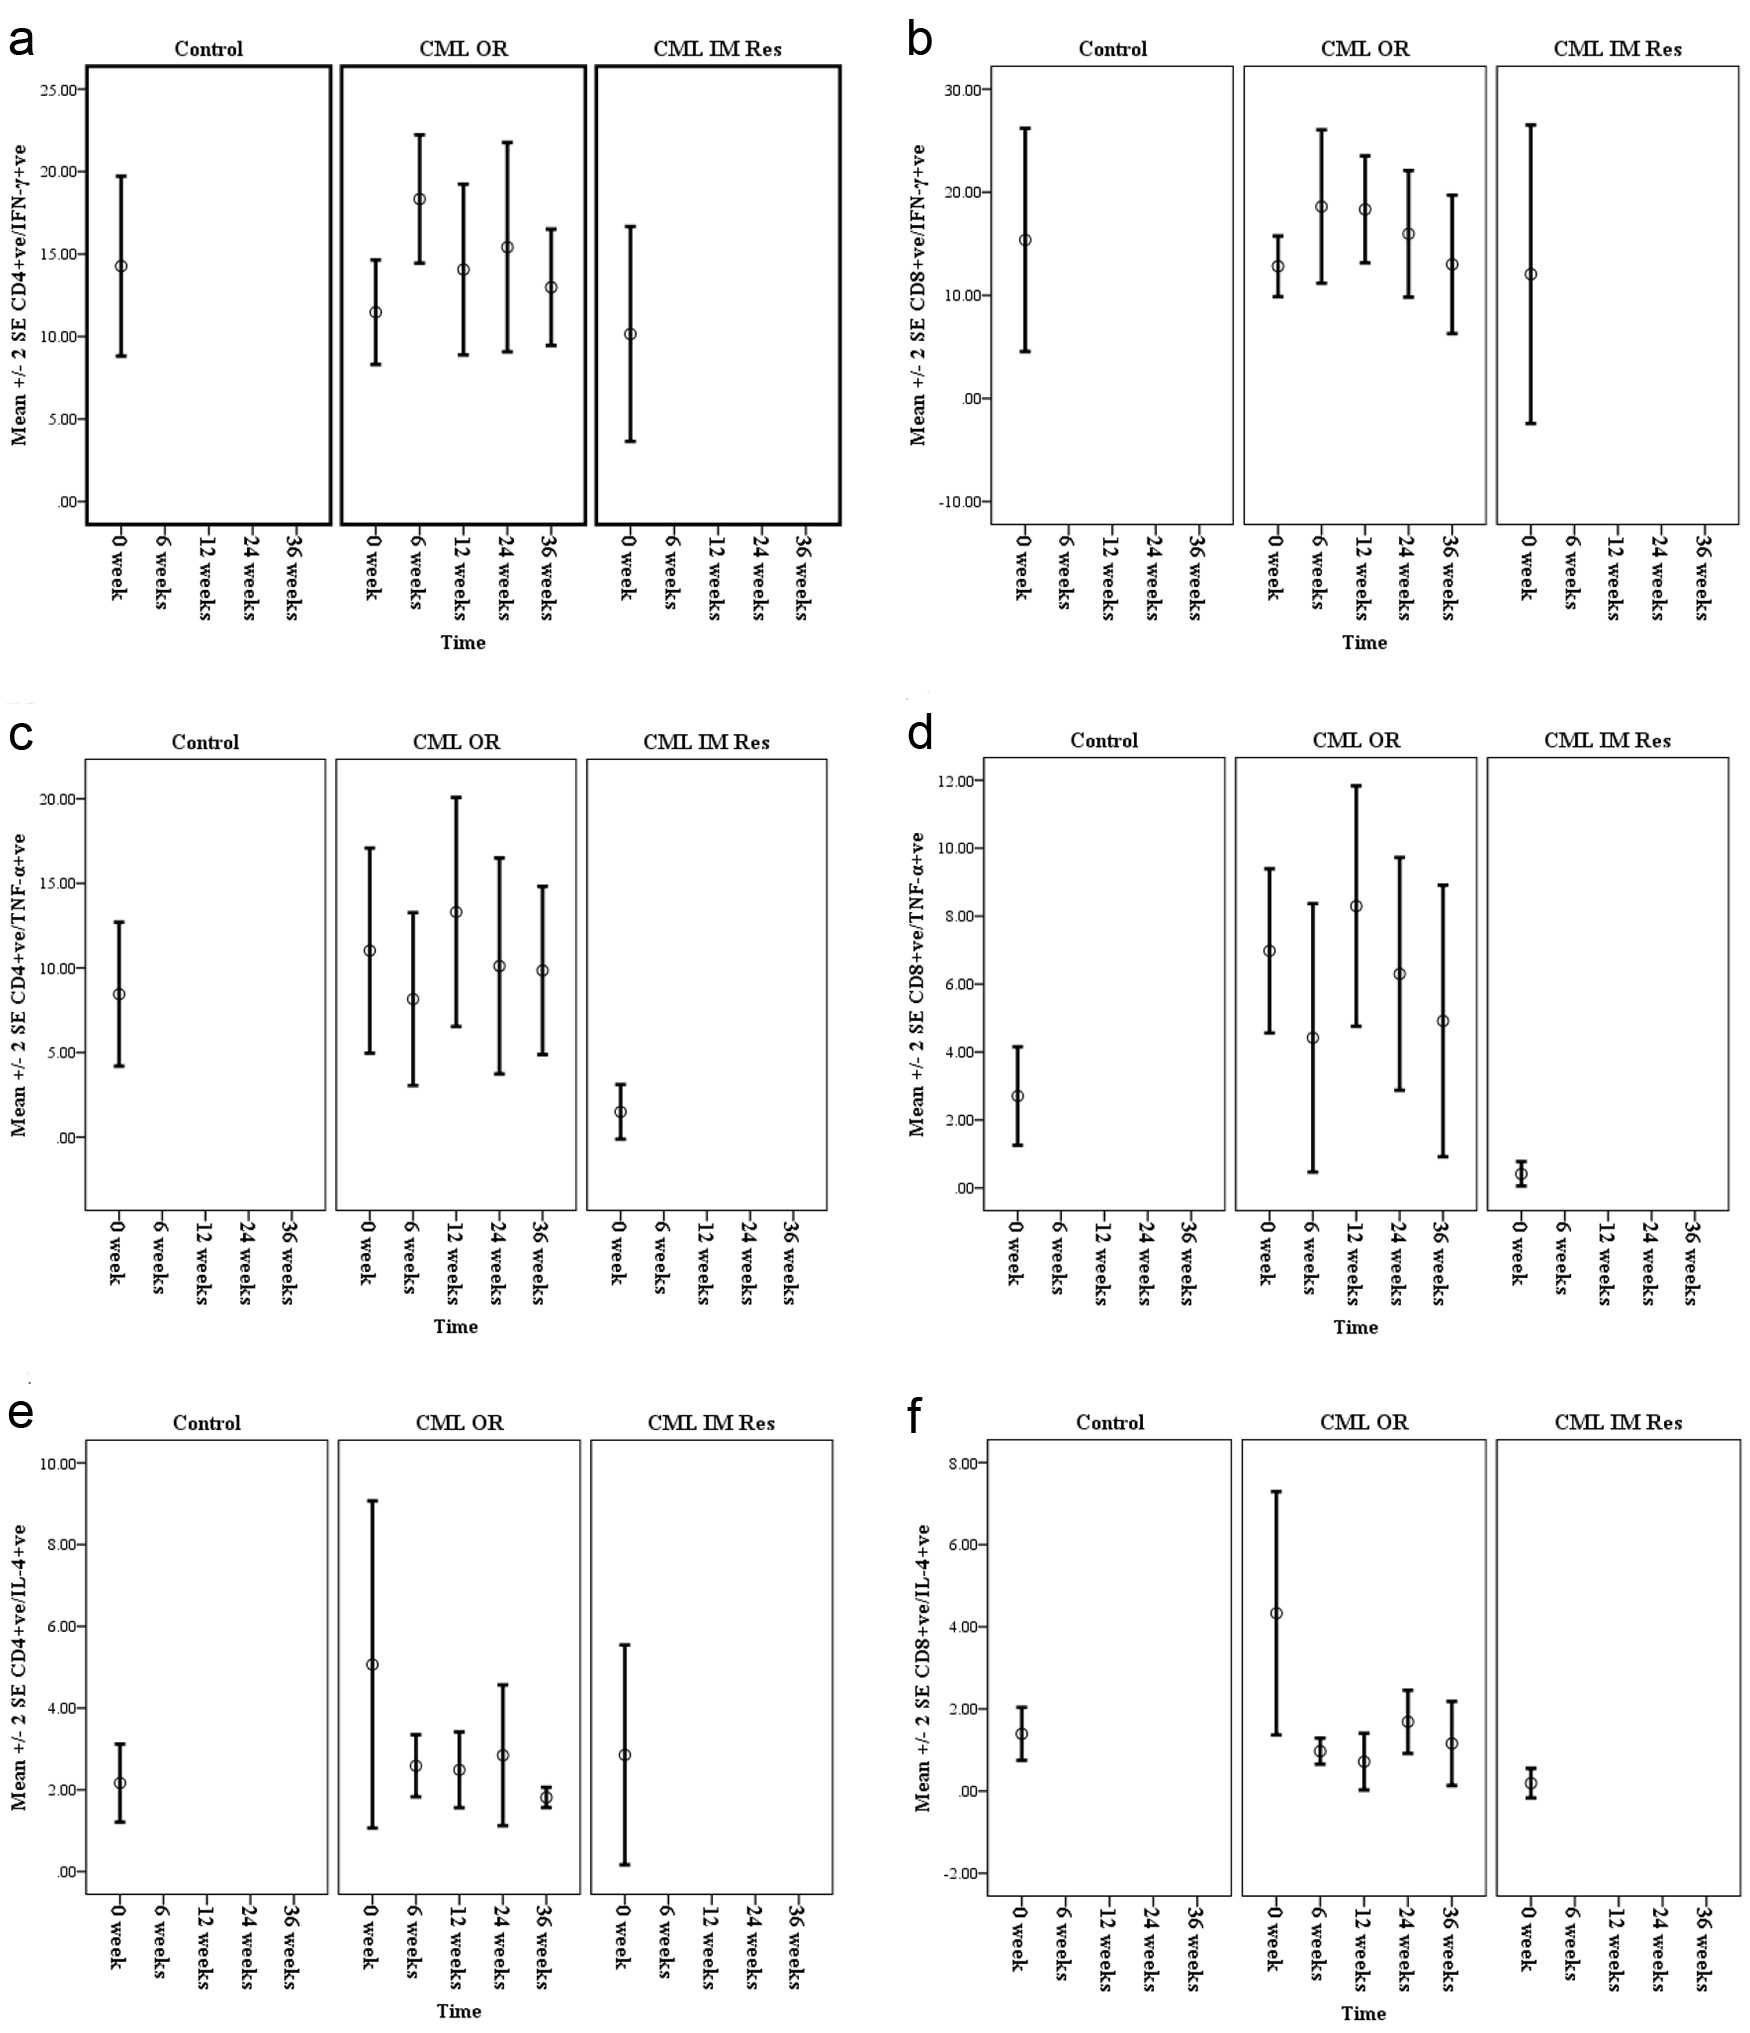 Click for large image | Figure 3. Mean percentages of IFN-ã (a and b), TNF-á (c and d) and IL-4 (e and f), synthesized by CD4+ve and CD8+ve T cells of chronic phase CML patients with optimal response (CML OR) pre- and during Imatinib therapy (6 weeks, 3 months, 6 months and 9 months) compared with normal controls and CML patients known to have Imatinib resistance (CML IM Res). |
2) TNF-α
There was an initial decline in the mean percentages of CD4+ve/TNF-α+ve and CD8+ve/TNF-α+ve T cells at the sixth week; however, the differences were not statistically significant. This initial drop was followed by an increase in the percentages of TNF-α synthesizing T cells to levels exceeding that of normal controls as well as that of pre-treatment; however, levels were not statistically significant. Although this was followed by a second decline at later follow-ups, both remained at levels exceeding that of normal controls (Fig. 3c & d).
3) IL-4
Already at 6 weeks there was a considerable drop in the mean percentages of CD4+ve/IL-4+ve and CD8+ve/IL-4+ve T cells reaching levels lower level than that of the pre-treatment but comparable to that of the normal control and were maintained throughout follow-up. However, the difference between mean percentages of both T-cell subsets pre-IM versus during IM therapy did not reach a statistical significance.
| Discussion | ▴Top |
Host immune system plays an important role in the development of cancer as well as in shaping the immunogenicity of the tumor. Recognition of established tumor by T cells depends on the level of tumor antigen expression which influences the circulating T cells either to elicit specific T-cell response or rendering them to remain ignorant and unresponsive (T-cell anergy). DC-T cell interaction plays an important role for an effective T-cells response which depends on the outcome of multiple DC-derived signals including antigen presentation by DC, co-stimulatory molecule (on DC and T cell surface), DC-derived cytokine signalling and chemokine signalling [29]. CD4 T cells plays a role in antitumor immunity where upon exposure to IL-12 they are polarized to Th1 phenotype secreting high levels of IFN-γ and TNF-α promoting antigen presentation by antigen-presenting cell (APC) and cell killing through activation and expansion of CD8+ CTL [30, 31], which are capable for lysing primary tumor cells in vitro via different mechanisms including release of direct toxic cytokines such as TNF-α [32]. In contrast, upon exposure to IL-4 CD4 T cells polarized to Th2 phenotype with express high levels of cytokines (IL-4, -5, -6, -7 and -10) which induce T-cell anergy and promoting tumor cell growth. While exposure of CD8-positive T cells to IL-4 during primary activation in vitro was reported to generate a population that express type 2 cytokines (IL-4, -5 and -10) with reduction in expression of IFN-γ with poor cytolytic function [33, 34]. Endogenous or exogenous IL-4 induces downregulation of CD8 expression [35]. IL-4 was also reported to induce activation of signal transducer and activation of transcription (STAT), which plays a fundamental role in tumor development and progression [36-38]. This reciprocal relation between endogenous IL-4 and IFN-γ in regulation of CD4 and CD8 T cells polarization and hence modulation of cytolytic potentials and anti-tumor function by CD8 T cells is also well characterized [39]. Data from our study confirmed this reciprocal relation between IFN-γ and IL-4, which was evident from the finding of lower percentage of T cells (CD4+ve and CD8+ve) that synthesize IFN-γ in pre-IM therapy sample from both CP CML patients as well as patients with IM Res compared to the control group and the finding of higher percentages of T cell synthesizing Th2 cytokine (IL-4) in pre-IM therapy sample of CP CML who subsequently showed optimal response to IM therapy. This is in agreement with previous reports where high levels of Th2 cytokine has been reported in CML CP patients compared to that of normal controls [6]. The decline in the levels of IL-4 producing cells was documented in our study as early as 6 weeks after start of IM therapy to levels lower than that in normal controls which continued to be suppressed throughout the patient’s follow-up period. This is in addition to the finding that IM therapy led to an increase in the mean percentages of IFN-γ synthesizing CD4+ve and CD8+ve T ells which were maintained during the first 6 months followed by a decline in levels at later follow-up samples. However, they remain at higher levels than the pre-treatment level for CD 4+ve T cells. Both an increase in percentage of IFN-γ synthesizing T cells and a decline in that of IL-4 synthesizing T cells with treatment confirm the shift from Th2 to Th1 cytokine profile which was found to be associated with good response to IM therapy where in our study 12 of our patients had at least 2 - 3 log reduction of baseline PCR documented after 6 - 12 months of treatment. In total 15 (75%) of our patients achieved CCYR, CMR or MMR within the first 12 months of therapy. Only three of our assessable patients had no or sub optimal response based on the international criteria [40].
In our study, we could demonstrate that the optimal responders (pre-IM therapy) had a higher percentage of TNF-α synthesizing T cells which was significantly higher for CD8+ve T cells than that of normal controls with a decline during the early phase of IM therapy in the percentages of both CD4+ and CD8+. Although this was followed by an increase in the percentages of both T-cell subsets which was subsequently followed by a second decline, it remained at a higher level than that of normal control. This result may appear to be contradicting what previously reported lower levels of TNF-α in CML CP and ACC phase patients [6]. However, in that study, the patients were under IFN-α treatment with exception of those at late CCR. Our result is in line with a study by Gao et al in 2005 [21] where early suppression of TNF-α was documented in two of their patients (the fifth day of treatment). The role of high percentage of pre-treatment TNF-α producing T-cell subset of CP CML who subsequently showed optimal response to IM therapy in addition to the tendency of lower percentage of TNF producing CD4+ and CD8+ T cells in sample from non-responders and those with known IM resistance compared to healthy control is not clear. Surprisingly, sample from patients who subsequently showed no optimal response as well as from patients with IM Res showed lower percentage of CD4+ve or CD8+ve T cells that produce IL-4 compared to optimal responders and normal controls. Both IL-4 and TNF play an important role in the generation and maturation of DCs. Previously published data showed that DCs could possibly be generated from peripheral blood mononuclear cells (PBMNCs) in the presence of IL-4 and G-CSF, while the presence of TNF in the culture promoted their maturation which is important for immune response as immature DCs can induce tolerance [41]. It was also shown that myeloid cell precursor from CML patients transformed to functioning DCs when cultured under the same conditions [42].
The maturation state and the number of DCs were shown to play an important role for adequate immune response and the presence of immature or partially mature DCs induces tolerance, inhibits Ag-specific T-cell response and contributes to tumor immune escape [43, 44]. The simultaneous increase in the percentages of IL-4 and TNF producing T-cell subsets in CP CML who subsequently showed optimal response to IM therapy suggested preserved potentials for adequate immune response while decrease in the percentages of IL-4 and TNF producing T-cell subsets in blood samples of patients with known IM Res compared to healthy control reflected state of immune tolerance in those patients where T cells remain ignorant and unresponsive (T-cell anergy) resulting from, possibly, decrease in generation of DCs from PBMCs and their maturation. The increase in percentage of TNF-α synthesizing T cells with more advanced response status was in line with the results published by both authors. TNF-α in the presence of IFN-γ was shown previously to markedly decreasing tumor growth and increasing apoptosis suggesting a synergistic cytokine-mediated effect contributing to enhancing tumor cell susceptibility to CD8 effector cells [45, 46]. However, roles of DCs and TNF-α in CML response to therapy need further investigation.
Conclusions
The CP CML patient has a Th2 cytokine profile at diagnosis. Cytokine responses with shift from a Th2 profile to a Th1 profile were detected early during IM therapy (as early as 6 weeks of treatment) coinciding with the achievement of CHR. This immunological response of T-cell subset during IM therapy preceded both the cytogenetic and molecular responses. A tendency for higher levels of Th1, Th2 and TNF-α synthesizing T cells prior to IM therapy was detected in optimal responders than non-optimal responders. We believe that pre-treatment level of IL-4 and/or TNF-α may have a significant role in predicting optimal respond of CP CML patients to IM therapy; however, further investigation is needed.
Conflict of Interest
All authors have no conflict of interest to report.
Author Contributions
The study is design by IBH and JK. Acquisition of data (lab work) by S.B. Data analysis and statistics by IBH, and interpretation of data by IBH. Drafting the article by IBH and revised critically for important intellectual content by IBH, JK and SB. Final approval for submission by IBH, JK and SB.
Financial Support
This work was supported by grants from Sheikh Hamdan Bin Rashid Al Maktoum award for medical sciences and grants from faculty of Medicine and Health Sciences, United Arab Emirates University. Study sponsors had no role in the study design, collection, analysis and interpretation of data; in the writing of the manuscript; and in the decision to submit the manuscript for publication.
| References | ▴Top |
- Faderl S, Talpaz M, Estrov Z, Kantarjian HM. Chronic myelogenous leukemia: biology and therapy. Ann Intern Med. 1999;131(3):207-219.
doi pubmed - Mackinnon S, Papadopoulos EB, Carabasi MH, Reich L, Collins NH, Boulad F, Castro-Malaspina H, et al. Adoptive immunotherapy evaluating escalating doses of donor leukocytes for relapse of chronic myeloid leukemia after bone marrow transplantation: separation of graft-versus-leukemia responses from graft-versus-host disease. Blood. 1995;86(4):1261-1268.
pubmed - Baron F, Storb R. The immune system as a foundation for immunologic therapy and hematologic malignancies: a historical perspective. Best Pract Res Clin Haematol. 2006;19(4):637-653.
doi pubmed - Kessler JH, Bres-Vloemans SA, van Veelen PA, de Ru A, Huijbers IJ, Camps M, Mulder A, et al. BCR-ABL fusion regions as a source of multiple leukemia-specific CD8+ T-cell epitopes. Leukemia. 2006;20(10):1738-1750.
doi pubmed - Marmont AM, Horowitz MM, Gale RP, Sobocinski K, Ash RC, van Bekkum DW, Champlin RE, et al. T-cell depletion of HLA-identical transplants in leukemia. Blood. 1991;78(8):2120-2130.
pubmed - Reuben JM, Lee BN, Johnson H, Fritsche H, Kantarjian HM, Talpaz M. Restoration of Th1 cytokine synthesis by T cells of patients with chronic myelogenous leukemia in cytogenetic and hematologic remission with interferon-alpha. Clin Cancer Res. 2000;6(5):1671-1677.
pubmed - Aswald JM, Lipton JH, Aswald S, Messner HA. Increased IFN-gamma synthesis by T cells from patients on imatinib therapy for chronic myeloid leukemia. Cytokines Cell Mol Ther. 2002;7(4):143-149.
doi pubmed - Aswald JM, Lipton JH, Messner HA. Intracellular cytokine analysis of interferon-gamma in T cells of patients with chronic myeloid leukemia. Cytokines Cell Mol Ther. 2002;7(2):75-82.
doi pubmed - Humlova Z, Klamova H, Janatkova I, Sandova P, Sterzl I, Sobotkova E, Hamsikova E, et al. Immunological profiles of patients with chronic myeloid leukaemia. I. State before the start of treatment. Folia Biol (Praha). 2006;52(3):47-58.
- Tsuda H, Yamasaki H. Type I and type II T cell profiles in chronic myelogenous leukemia. Acta Haematol. 2000;103(2):96-101.
doi pubmed - Ptackova P, Petrackova M, Hindos M, Duskova M, Hamsikova E, Klamova H, Pecherkova P, et al. Intracellular Cytokines Produced by Stimulated CD3+ Cells from Chronic Myeloid Leukemia Patients. Acta Haematol. 2017;137(3):148-157.
doi pubmed - Kiani A, Habermann I, Schake K, Neubauer A, Rogge L, Ehninger G. Normal intrinsic Th1/Th2 balance in patients with chronic phase chronic myeloid leukemia not treated with interferon-alpha or imatinib. Haematologica. 2003;88(7):754-761.
pubmed - Cortes JE, Baccarani M, Guilhot F, Druker BJ, Branford S, Kim DW, Pane F, et al. Phase III, randomized, open-label study of daily imatinib mesylate 400 mg versus 800 mg in patients with newly diagnosed, previously untreated chronic myeloid leukemia in chronic phase using molecular end points: tyrosine kinase inhibitor optimization and selectivity study. J Clin Oncol. 2010;28(3):424-430.
doi pubmed - Hughes TP, Hochhaus A, Branford S, Muller MC, Kaeda JS, Foroni L, Druker BJ, et al. Long-term prognostic significance of early molecular response to imatinib in newly diagnosed chronic myeloid leukemia: an analysis from the International Randomized Study of Interferon and STI571 (IRIS). Blood. 2010;116(19):3758-3765.
doi pubmed - Kantarjian HM, Talpaz M, Cortes J, O'Brien S, Faderl S, Thomas D, Giles F, et al. Quantitative polymerase chain reaction monitoring of BCR-ABL during therapy with imatinib mesylate (STI571; gleevec) in chronic-phase chronic myelogenous leukemia. Clin Cancer Res. 2003;9(1):160-166.
pubmed - Hughes TP, Kaeda J, Branford S, Rudzki Z, Hochhaus A, Hensley ML, Gathmann I, et al. Frequency of major molecular responses to imatinib or interferon alfa plus cytarabine in newly diagnosed chronic myeloid leukemia. N Engl J Med. 2003;349(15):1423-1432.
doi pubmed - Cortes J, Talpaz M, O'Brien S, Jones D, Luthra R, Shan J, Giles F, et al. Molecular responses in patients with chronic myelogenous leukemia in chronic phase treated with imatinib mesylate. Clin Cancer Res. 2005;11(9):3425-3432.
doi pubmed - Villuendas R, Steegmann JL, Pollan M, Tracey L, Granda A, Fernandez-Ruiz E, Casado LF, et al. Identification of genes involved in imatinib resistance in CML: a gene-expression profiling approach. Leukemia. 2006;20(6):1047-1054.
doi pubmed - Brauer KM, Werth D, von Schwarzenberg K, Bringmann A, Kanz L, Grunebach F, Brossart P. BCR-ABL activity is critical for the immunogenicity of chronic myelogenous leukemia cells. Cancer Res. 2007;67(11):5489-5497.
doi pubmed - Chen CI, Maecker HT, Lee PP. Development and dynamics of robust T-cell responses to CML under imatinib treatment. Blood. 2008;111(11):5342-5349.
doi pubmed - Gao H, Lee BN, Talpaz M, Donato NJ, Cortes JE, Kantarjian HM, Reuben JM. Imatinib mesylate suppresses cytokine synthesis by activated CD4 T cells of patients with chronic myelogenous leukemia. Leukemia. 2005;19(11):1905-1911.
doi pubmed - Hayashi Y, Nakamae H, Katayama T, Nakane T, Koh H, Nakamae M, Hirose A, et al. Different immunoprofiles in patients with chronic myeloid leukemia treated with imatinib, nilotinib or dasatinib. Leuk Lymphoma. 2012;53(6):1084-1089.
doi pubmed - Leder C, Ortler S, Seggewiss R, Einsele H, Wiendl H. Modulation of T-effector function by imatinib at the level of cytokine secretion. Exp Hematol. 2007;35(8):1266-1271.
doi pubmed - Appel S, Boehmler AM, Grunebach F, Muller MR, Rupf A, Weck MM, Hartmann U, et al. Imatinib mesylate affects the development and function of dendritic cells generated from CD34+ peripheral blood progenitor cells. Blood. 2004;103(2):538-544.
doi pubmed - Taieb J, Maruyama K, Borg C, Terme M, Zitvogel L. Imatinib mesylate impairs Flt3L-mediated dendritic cell expansion and antitumor effects in vivo. Blood. 2004;103(5):1966-1967; author reply 1967.
- Eisendle K, Wolf D, Gastl G, Kircher-Eibl B. Dendritic cells from patients with chronic myeloid leukemia: functional and phenotypic features. Leuk Lymphoma. 2005;46(5):663-670.
doi pubmed - Sato N, Narita M, Takahashi M, Yagisawa K, Liu A, Abe T, Nikkuni K, et al. The effects of STI571 on antigen presentation of dendritic cells generated from patients with chronic myelogenous leukemia. Hematol Oncol. 2003;21(2):67-75.
doi pubmed - North ME, Ivory K, Funauchi M, Webster AD, Lane AC, Farrant J. Intracellular cytokine production by human CD4+ and CD8+ T cells from normal and immunodeficient donors using directly conjugated anti-cytokine antibodies and three-colour flow cytometry. Clin Exp Immunol. 1996;105(3):517-522.
doi pubmed - Benencia F, Sprague L, McGinty J, Pate M, Muccioli M. Dendritic cells the tumor microenvironment and the challenges for an effective antitumor vaccination. J Biomed Biotechnol. 2012;2012:425476.
doi pubmed - Ellyard JI, Simson L, Parish CR. Th2-mediated anti-tumour immunity: friend or foe? Tissue Antigens. 2007;70(1):1-11.
doi pubmed - Kim R, Emi M, Tanabe K. Cancer immunoediting from immune surveillance to immune escape. Immunology. 2007;121(1):1-14.
doi pubmed - Macgregor JN, Li Q, Chang AE, Braun TM, Hughes DP, McDonagh KT. Ex vivo culture with interleukin (IL)-12 improves CD8(+) T-cell adoptive immunotherapy for murine leukemia independent of IL-18 or IFN-gamma but requires perforin. Cancer Res. 2006;66(9):4913-4921.
doi pubmed - Erard F, Wild MT, Garcia-Sanz JA, Le Gros G. Switch of CD8 T cells to noncytolytic CD8-CD4- cells that make TH2 cytokines and help B cells. Science. 1993;260(5115):1802-1805.
doi pubmed - Kienzle N, Buttigieg K, Groves P, Kawula T, Kelso A. A clonal culture system demonstrates that IL-4 induces a subpopulation of noncytolytic T cells with low CD8, perforin, and granzyme expression. J Immunol. 2002;168(4):1672-1681.
doi pubmed - Kienzle N, Olver S, Buttigieg K, Groves P, Janas ML, Baz A, Kelso A. Progressive differentiation and commitment of CD8+ T cells to a poorly cytolytic CD8low phenotype in the presence of IL-4. J Immunol. 2005;174(4):2021-2029.
doi pubmed - Skinnider BF, Elia AJ, Gascoyne RD, Patterson B, Trumper L, Kapp U, Mak TW. Signal transducer and activator of transcription 6 is frequently activated in Hodgkin and Reed-Sternberg cells of Hodgkin lymphoma. Blood. 2002;99(2):618-626.
doi pubmed - Kawakami M, Kawakami K, Kioi M, Leland P, Puri RK. Hodgkin lymphoma therapy with interleukin-4 receptor-directed cytotoxin in an infiltrating animal model. Blood. 2005;105(9):3707-3713.
doi pubmed - Yu H, Pardoll D, Jove R. STATs in cancer inflammation and immunity: a leading role for STAT3. Nat Rev Cancer. 2009;9(11):798-809.
doi pubmed - Apte SH, Groves P, Olver S, Baz A, Doolan DL, Kelso A, Kienzle N. IFN-gamma inhibits IL-4-induced type 2 cytokine expression by CD8 T cells in vivo and modulates the anti-tumor response. J Immunol. 2010;185(2):998-1004.
doi pubmed - Baccarani M, Saglio G, Goldman J, Hochhaus A, Simonsson B, Appelbaum F, Apperley J, et al. Evolving concepts in the management of chronic myeloid leukemia: recommendations from an expert panel on behalf of the European LeukemiaNet. Blood. 2006;108(6):1809-1820.
doi pubmed - Miwa S, Nishida H, Tanzawa Y, Takata M, Takeuchi A, Yamamoto N, Shirai T, et al. TNF-alpha and tumor lysate promote the maturation of dendritic cells for immunotherapy for advanced malignant bone and soft tissue tumors. PLoS One. 2012;7(12):e52926.
doi pubmed - Choudhury A, Gajewski JL, Liang JC, Popat U, Claxton DF, Kliche KO, Andreeff M, et al. Use of leukemic dendritic cells for the generation of antileukemic cellular cytotoxicity against Philadelphia chromosome-positive chronic myelogenous leukemia. Blood. 1997;89(4):1133-1142.
pubmed - Almand B, Clark JI, Nikitina E, van Beynen J, English NR, Knight SC, Carbone DP, et al. Increased production of immature myeloid cells in cancer patients: a mechanism of immunosuppression in cancer. J Immunol. 2001;166(1):678-689.
doi pubmed - Lu G, Janjic BM, Janjic J, Whiteside TL, Storkus WJ, Vujanovic NL. Innate direct anticancer effector function of human immature dendritic cells. II. Role of TNF, lymphotoxin-alpha(1)beta(2), Fas ligand, and TNF-related apoptosis-inducing ligand. J Immunol. 2002;168(4):1831-1839.
doi pubmed - Dobrzanski MJ, Reome JB, Dutton RW. Immunopotentiating role of IFN-gamma in early and late stages of type 1 CD8 effector cell-mediated tumor rejection. Clin Immunol. 2001;98(1):70-84.
doi pubmed - Dobrzanski MJ, Reome JB, Dutton RW. Role of effector cell-derived IL-4, IL-5, and perforin in early and late stages of type 2 CD8 effector cell-mediated tumor rejection. J Immunol. 2001;167(1):424-434.
doi pubmed
This article is distributed under the terms of the Creative Commons Attribution Non-Commercial 4.0 International License, which permits unrestricted non-commercial use, distribution, and reproduction in any medium, provided the original work is properly cited.
Journal of Hematology is published by Elmer Press Inc.