


| Journal of Hematology, ISSN 1927-1212 print, 1927-1220 online, Open Access |
| Article copyright, the authors; Journal compilation copyright, J Hematol and Elmer Press Inc |
| Journal website http://www.thejh.org |
Original Article
Volume 2, Number 1, June 2013, pages 22-26
Plateletcrit as a Screening Tool for Detection of Platelet Quantitative Disorders
Vani Chandrashekar
Department of Hematology, Apollo Hospitals, 21, Greams Lane, Off Greams Road, Chennai, Tamil Nadu, India
Manuscript accepted for publication March 15, 2013
Short title: Plateletcrit as Screening Tool
doi: https://doi.org/10.4021/jh70w
| Abstract | ▴Top |
Background: Context-Plateletcrit is a measure of total platelet mass. Values vary depending on mean platelet volume resulting in overlap between normal platelets, thrombocytopenia and thrombocytosis. Aims of this study were to record platelet indices in our hospital set up and evaluate normal range of plateletcrit which could screen thrombocytopenia, thrombocytosis and normal platelet count.
Methods: We studied platelet indices in 206 patients using Advia 2120 analyzer. At seven different cut off ranges of Plateletcrit the sensitivity and specificity for detecting thrombocytopenia and thrombocytosis was calculated.
Results: The average of Mean platelet volume was 9.13 fl, plateletcrit- 0.23% and Platelet distribution width-56.6% in normal platelet counts. Sensitivity and specificity for detection of thrombocytopenia at plateletcrit cut off range of 0.20-0.36% is 97 and 80% and 94 and 98% for thrombocytosis.
Conclusion: In our hospital set up we found that majority of our patients with normal platelet count have a plateletcrit within the range of 0.20-0.36%. Plateletcrit is an effective screening tool for detecting platelet quantitative abnormalities.
Keywords: Plateletcrit; Mean platelet volume; Platelet distribution width
| Introduction | ▴Top |
Some of the important platelet parameters reported by automated analyzers today are platelet count, the mean platelet volume (MPV), platelet distribution width (PDW) and plateletcrit (Pct). The platelet indices (MPV, PDW) have been found to be clinically useful in distinguishing immune thrombocytopenic purpura (ITP) from thrombocytopenia caused by underproduction of platelets. Ntaios G and others observed that an increased MPV and PDW were seen in immune thrombocytopenic purpura [1]. Kaito K and others similarly, reported a significantly increased MPV and PDW in ITP than in aplastic anemia [2].
An inverse relationship between MPV and platelet count have been described in some studies [3]. Giovanetti TV and others studied platelet indices in 306 individuals. They observed that the MPV in men was 9.66 ± 0.46 fl and 9.89 ± 1.40 fl in women. They found significant differences in Pct with relation to gender and age [4]. In their study the mean Pct for men was 0.24% and 0.28% for women. Wiwanitkit studied platelet parameters in 215 volunteers and their reported value for Pct was 0.24 ± 0.05%, 12.79 ± 5.9 fl for MPV and 46.79 ± 2.70% for PDW [5]. A reference range of 10-17.9% for PDW has been described by some observers [6]. They conducted their study on 231 blood samples on the Pentra 120 ABX hematology analyzer. In Iranians the reference ranges for platelet count is 237 ± 55.2 × 10⁹/L, 46.9 ± 5.7% for PDW, 0.22 ± 0.05% for Pct and 9.2 ± 2.9 fl for MPV [7]. A recent study on the Indian population revealed that blood donors from North Eastern India had mean platelet count of 132 (range 71 - 267) × 109/L, MPV of 13.1fl (12 - 21.9), Pct of 0.17% (0.10 - 0.38) and PDW of 17.4 fl (14.9 - 19.6). The corresponding values in South Indian blood donors were 252 × 109/L (160 - 478) for platelet count, 7.35fl (6 - 9.2) for MPV, 0.19% (1.13 - 1.28) for Pct and 16.38 fl (15.2 - 18.5) for PDW [8].
In the present study we evaluated platelet indices, with emphasis on normal Pct range, in 206 patients visiting a tertiary care hospital in South India. Our patients include people from North Eastern India as well as surrounding areas in South India. The existence of Harris platelet syndrome in North East India is well known. Their low platelet counts causes concern among the clinicians while administering chemotherapy or undertaking surgical procedures. Hence there was an urgent local need for determination of acceptable platelet parameters for any patient in our hospital setup which was the primary aim of this study.
| Materials and Methods | ▴Top |
We collected platelet parameters from 210 EDTA anticoagulated blood samples. The blood samples were selected randomly. All samples were collected by venipuncture and processed within an hour of collection in the Advia 2120 automated analyzer. Three of the samples showed chronic myeloproliferative disorder on peripheral smear examination and were excluded. One sample showed EDTA induced platelet clumping and was excluded. Leishman stained peripheral smears were examined for all cases to rule out pseudo thrombocytopenia.
We grouped our cases in to three categories, one group with normal platelet count (between 150 - 450 × 109/L), second group with thrombocytopenia(less than 150 × 109/L) and third group with thrombocytosis (more than 450 × 109/L). The averages platelet count, MPV, Pct and PDW for each group were calculated. We then divided the 206 cases on the basis of Pct. For this, we set seven cut off levels for Pct and for each cut off level the truth table was drawn for both thrombocytopenia and thrombocytosis. The cut off levels were considered useful if the sum of sensitivity and specificity exceeded 170. The cut off levels we used in this study were: 0.01 - 0.10, 0.11 - 0.21, 0.22 - 0.32, 0.33 - 0.43, 0.44 - 0.54, 0.55 - 0.65 and 0.66-0.76%. For these cut off ranges Pct values below the lower level of a particular range was considered as thrombocytopenia if the platelet number was below 150 × 109/L (true positive) and Pct values above the higher level of the cut off was considered to be thrombocytosis if platelet count exceeded 450 × 109/L (true positive). The receiver operating characteristic curves (ROC) were plotted and area under curve (AUC) calculated using Vassar stats (online resource).
| Results | ▴Top |
Among 206 cases we studied, 106 patients had thrombocytopenia, 82 had normal number of platelets and 18 had thrombocytosis.
Normal platelet group
In this group there were 53 males and 29 female patients. The average platelet count was 269.35 (SD- 81.55) × 109/L with a range of 150 - 445 × 109/L. Mean Pct was 0.23% (SD- 0.06) with a range of 0.13-0.43%. The average MPV was 9.13 fl (SD-1.86) with a range of 6.7-14.7 fl (Table 1). The range of PDW was 16.9-76.5% with an average of 56.65% (SD- 11.90).
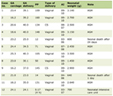 Click to view | Table 1. Comparison of the Three Groups |
Thrombocytopenia group
There were 81 male and 25 female patients in this group. The range of platelet count varied from 2 - 147 × 109/L with an average of 72.58 × 10⁹/L (SD-34.34). The average Pct was 0.09% (SD-0.04) with a range of 0-0.22% (Table 1). The MPV varied from a low 7.4 fl to 24.9 fl with an average of 12.42 fl (SD- 3.84). Mean PDW was 63.8% (SD- 15.98) with a range of 18.5 to 87.5%.
Thrombocytosis group
We had 15 male patients and three female patients with platelets above 450 × 109/L. The average platelet count was 606 × 109/L (SD- 114.3). The platelet count varied from 455 - 879 × 109/L. The mean Pct was 0.50% (SD- 0.09) with a range of 0.36-0.69% (Table 1). The average MPV was 8.3 fl (SD- 1.23) with a range of 6.8-11.7fl. The PDW varied from 33.7-62.7% with an average of 49.36 (SD- 7.21).
It is evident from Table 1 that as we move from thrombocytopenia to thrombocytosis group there is an increase in platelet count with corresponding increase in Pct. Conversely, the MPV and PDW decrease as platelet count increases.
Tables 2 and 3 show the number of positive and negative cases at Pct cut off levels of 0.01-0.10, 0.11-0.21, 0.22-0.32, 0.33-0.43, 0.44-0.54, 0.55-0.65 and 0.66-0.76% for thrombocytopenia and thrombocytosis respectively. The ROC curves plotted with the above cut off levels (Fig. 1, 2) showed AUC of 1 for both thrombocytopenia and thrombocytosis. At the cut off level of 0.22-0.32 (Table 3) the sensitivity and specificity for thrombocytosis (above 0.32%) is 100 and 94% (together 194) respectively. However, at this cut off the sensitivity and specificity for thrombocytopenia (Pct below 0.22%) was 99 and 65% (together 164) which is not satisfactory.
Click to view | Table 2. Pct Cut Off Values With Positive and Negative Cases for Thrombocytopenia |
Click to view | Table 3. Pct Cut Off Values With Positive and Negative Cases for Thrombocytosis |
 Click for large image | Figure 1. ROC for thrombocytopenia. |
 Click for large image | Figure 2. ROC for thrombocytosis. |
As none of the cut off levels had acceptable specificity and sensitivity we set a new cut off level of 0.20-0.36% and the truth tables for this cut off level is represented by Tables 4 and 5. The sensitivity, specificity for thrombocytopenia (below 0.20%) is 97 and 80% respectively (together 177). The positive and negative predictive value for detection of thrombocytopenia is 83 and 96% respectively. The sensitivity and specificity for thrombocytosis (Pct above 0.36%) is 94 and 98% respectively (together 192). The positive and negative predictive values for the same are 85 and 99% respectively.
Click to view | Table 4. Truth Table for Thrombocytopenia at Plateletcrit Below 0.20% |
Click to view | Table 5. Truth Table for Thrombocytosis at Plateletcrit Above 0.36% |
| Discussion | ▴Top |
There are many studies in literature stating normal ranges of platelet indices in different geographical locations [4-8]. The purpose of our study was to establish cut off ranges of Pct for defining platelet quantitative abnormalities in our hospital set up in Advia 2120 analyzer.
In this study we analyzed platelet indices from 206 patients. The average MPV in our study was comparable to the study by Adibi P (9.13 vs. 9.2 fl) whereas, it was slightly lesser than MPV recorded by Giovanetti TV and others (9.13 vs. 9.6 fl). Wiwanitkit V reported a higher MPV of 12.79 fl (Table 6). Our observed value for MPV was noted to be higher than South Indian blood donors (9.13 vs. 7.35 fl) and lesser than Northeast Indian blood donors (9.13 vs. 13.1 fl) (Table 6). The observed Pct value was similar to that reported by Giovanetti TV (0.23 vs. 0.24%), Wiwanitkit V (0.23 vs. 0.24%) and Adibi P (0.23 vs. 0.22%). However it was found to be much higher when compared to the study by Naina HV (0.23 vs. 0.17 in Northeast India and 0.19 in South India). The PDW was found to be higher than in other studies (56.6% vs. 46.7% in Wiwanitkit’s study and 46.9% in Adibi’s study.
Click to view | Table 6. Comparison With Other Studies |
With the average Pct we observed in this study, nearly 46.3% of our patients with normal platelet count would have low Pct values. There is significant overlap of Pct between thrombocytopenic patients and patients with normal platelets. This is of course due to the variation in MPV which is one of the factors affecting Pct. In this study, we found that the cut off range of 0.20-0.36% was helpful in distinguishing thrombocytopenia, normal platelet count and thrombocytosis with sensitivity of 97% and 80% for thrombocytopenia and 94 and 98% for thrombocytosis. This finding indicates that plateletcrit can be used instead of platelet counts alone to determine if the patient needs platelet transfusions and is a useful screening tool for detection of platelet quantitative disorders. With varying platelet counts in such conditions as Harris platelet syndrome it becomes difficult for clinicians to administer chemotherapy or undertake surgical procedures. Pct is a measure of the total platelet mass and may come across to be more clinically useful than being just an additional value to the laboratory. Can Pct in addition to platelet count be used to direct therapies or evaluate surgical outcome in future? We hope future studies in this direction could resolve this question.
Conflict of Interest
None.
| References | ▴Top |
- Ntaios G, Papadopoulos A, Chatzinikolaou A, Saouli Z, Karalazou P, Kaiafa G, Girtovitis F, et al. Increased values of mean platelet volume and platelet size deviation width may provide a safe positive diagnosis of idiopathic thrombocytopenic purpura. Acta Haematol. 2008;119(3):173-177.
doi - Kaito K, Otsubo H, Usui N, Yoshida M, Tanno J, Kurihara E, Matsumoto K, et al. Platelet size deviation width, platelet large cell ratio, and mean platelet volume have sufficient sensitivity and specificity in the diagnosis of immune thrombocytopenia. Br J Haematol. 2005;128(5):698-702.
doi - Jackson SR, Carter JM. Platelet volume: laboratory measurement and clinical application. Blood Rev. 1993;7(2):104-113.
doi - Giovanetti TV, do Nascimento AJ, de Paula JP. Platelet indices: laboratory and clinical applications. Rev Bras Hematol Hemoter. 2011;33(2):164-165.
doi - Wiwanitkit V. Plateletcrit, mean platelet volume, platelet distribution width: its expected values and correlation with parallel red blood cell parameters. Clin Appl Thromb Hemost. 2004;10(2):175-178.
doi - Farias MG, Schunck EG, Dal Bo S, de Castro SM. Definition of reference ranges for the platelet distribution width (PDW): a local need. Clin Chem Lab Med. 2010;48(2):255-257.
doi - Adibi P, Faghih Imani E, Talaei M, Ghanei M. Population-based platelet reference values for an Iranian population. Int J Lab Hematol. 2007;29(3):195-199.
doi - Naina HV, Harris S. Platelet and red blood cell indices in Harris platelet syndrome. Platelets. 2010;21(4):303-306.
doi
This is an open-access article distributed under the terms of the Creative Commons Attribution License, which permits unrestricted use, distribution, and reproduction in any medium, provided the original work is properly cited.
Journal of Hematology is published by Elmer Press Inc.