Journal of Hematology, ISSN 1927-1212 print, 1927-1220 online, Open Access
Article copyright, the authors; Journal compilation copyright, J Hematol and Elmer Press Inc
Journal website https://www.thejh.org

Original Article

Volume 10, Number 4, August 2021, pages 187-195


Treatment Outcomes and Survival Patterns of Asian Patients With Relapsed/Refractory Mantle Cell Lymphoma

Figures

Figure 1.
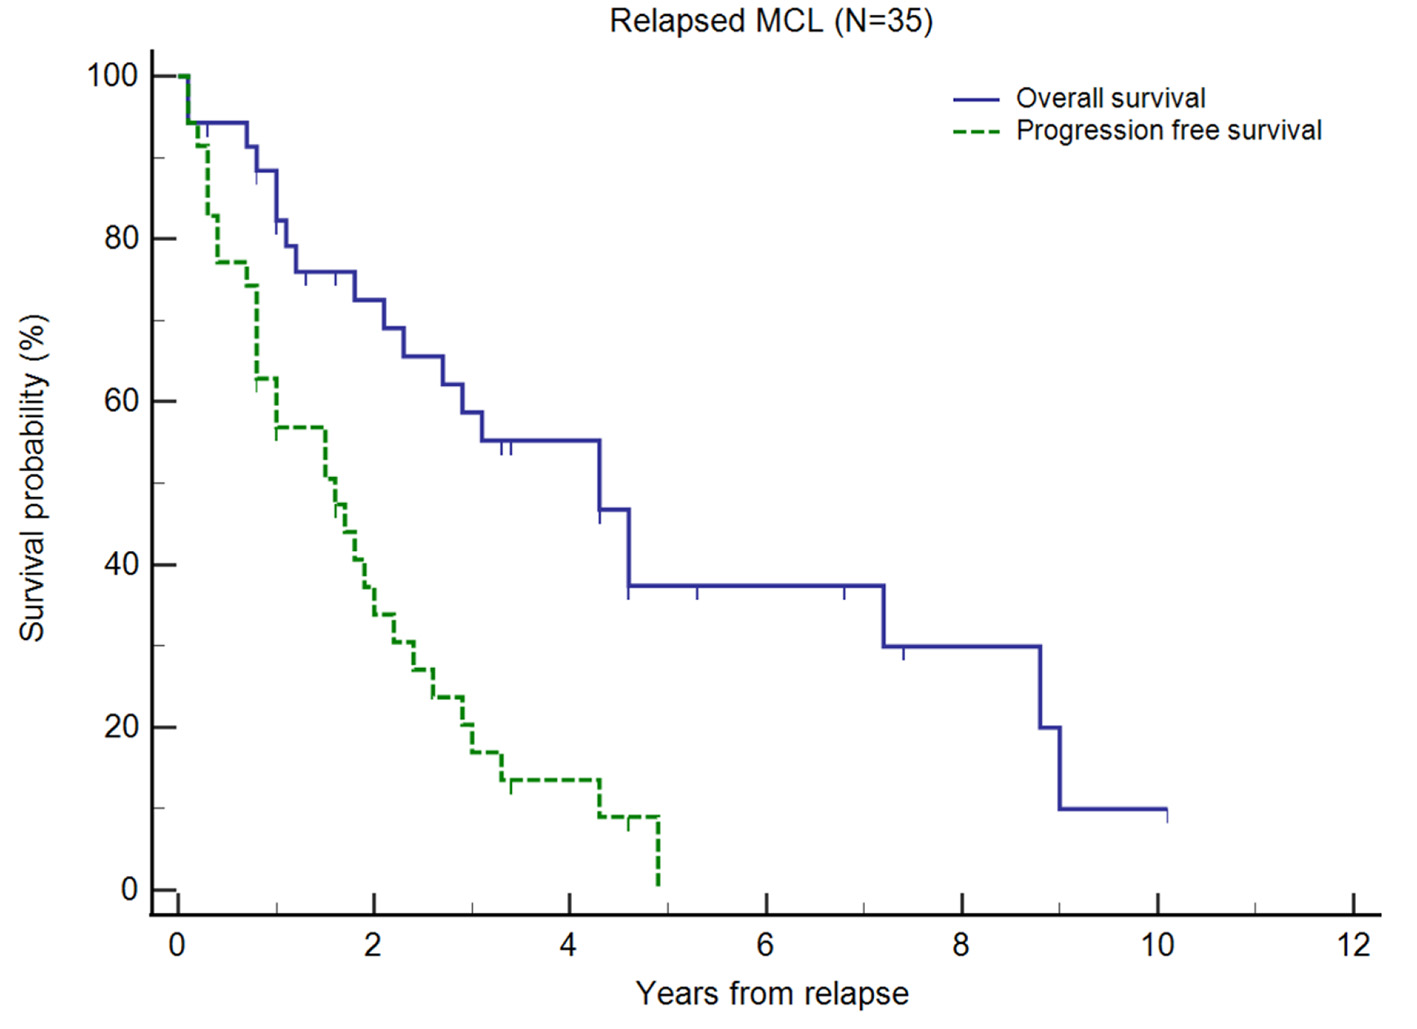
Figure 1. Kaplan-Meier plots of overall survival (OS) and progression-free survival (PFS) of relapsed/refractory (R/R) mantle cell lymphoma (MCL) from first relapse. Small vertical lines on the graph represent censored observations when patients are lost to follow-up.
Figure 2.
Figure 2. Kaplan-Meier plots of overall survival (OS) and progression-free survival (PFS) of relapsed/refractory (R/R) mantle cell lymphoma (MCL) at each relapse.
Figure 3.
Figure 3. Prognostic factors for survival outcomes in patients with relapsed/refractory (R/R) mantle cell lymphoma (MCL) at first relapse.

Tables

Table 1. Clinical Features of R/R MCL Cohort at Diagnosis
 
CharacteristicN (%)
aR-HyperCVAD (n = 13), HyperCVAD (n = 2), R-CHOP/R-ARAC (n = 2), R-BAC (n = 1). bR-CHOP (n = 9), CHOP (n = 2), R-CVP (n = 1), VR-CAP (n = 3), R-bendamustine (n = 2). R/R: relapsed/refractory; MCL: mantle cell lymphoma; ECOG: Eastern Cooperative Oncology Group; sMIPI: simplified Mantle Cell Lymphoma International Prognostic Index; CNS: central nervous system; CR: complete remission; PR: partial remission.
Total35 (100)
Age (years), median (range)58 (52 - 66)
Sex
  Male26 (74.3)
  Female9 (25.7)
Ethnicity
  Chinese26 (74.3)
  Malay4 (11.4)
  Indian2 (5.7)
  Others3 (8.6)
ECOG performance status
  022 (62.9)
  112 (34.3)
  21 (2.9)
Ann Arbor stage
  12 (5.7)
  21 (2.9)
  38 (22.9)
  424 (68.6)
sMIPI risk
  Low12 (34.3)
  Intermediate16 (45.7)
  High7 (20)
Extra-nodal involvement
  Yes30 (85.7)
  No5 (14.3)
CNS involvement
  Yes5 (14.3)
  No30 (85.7)
Bone marrow involvement
  Yes22 (62.9)
  No13 (37.1)
Splenic involvement
  Yes10 (28.6)
  No25 (71.4)
Ki-67 expression (%)
  < 307 (20)
  ≥ 3015 (42.9)
  Unknown13 (37.1)
First-line treatment received
  Induction chemotherapy
    Cytarabine-baseda18 (51.4)
    Non-cytarabine-basedb17 (48.6)
  Consolidation autologous stem cell transplant
    Yes5 (14.3)
    No30 (85.7)
  Maintenance rituximab
    Yes11 (31.4)
    No24 (68.6)
Best response to initial treatment
  CR26 (74.3)
  PR9 (26.7)
Time to first relapse
  Relapsed < 2 years from diagnosis13 (37.1)
  Relapsed > 2 years from diagnosis22 (62.9)


Table 2. Clinical Features of Study Cohort at Each Time of Relapse
 
CharacteristicFirst relapse (n = 35)Second relapse (n = 24)Third relapse and beyond (n = 15)
CNS: central nervous system; CR: complete remission; PR: partial remission; SD: stable disease; PD: progressive disease.
Age (years), median (range)62 (57 - 70)64 (61 - 70)66 (61 - 73)
Site involved at each relapse, N (%)
  Nodal only
    Yes14 (40)10 (41.6)8 (53.3)
    No21 (60)14 (58.4)7 (46.7)
  CNS
    Yes1 (2.9)0 (0)0 (0)
    No34 (97.1)24 (100)15 (100)
  Bone marrow
    Yes4 (11.4)3 (12.5)0 (0)
    No31 (88.6)21 (87.5)15 (100)
  Other extranodal sites
    Yes17 (48.6)11 (45.8)2 (13.3)
    No18 (51.4)13 (54.2)13 (86.7)
Time to relapse from diagnosis/prior relapse (months), median (range)40.1 (17.0 - 51.5)19.8 (9.6 - 30.9)7.6 (6.4 - 19.5)
Best response to treatment, N (%)
  CR13 (37.1)7 (29.2)0 (0)
  PR5 (14.3)3 (12.5)0 (0)
  SD10 (28.6)4 (16.7)1 (6.7)
  PD or death7 (20.0)8 (33.3)14 (93.3)
  Unknown0 (0)2 (8.3)0 (0)