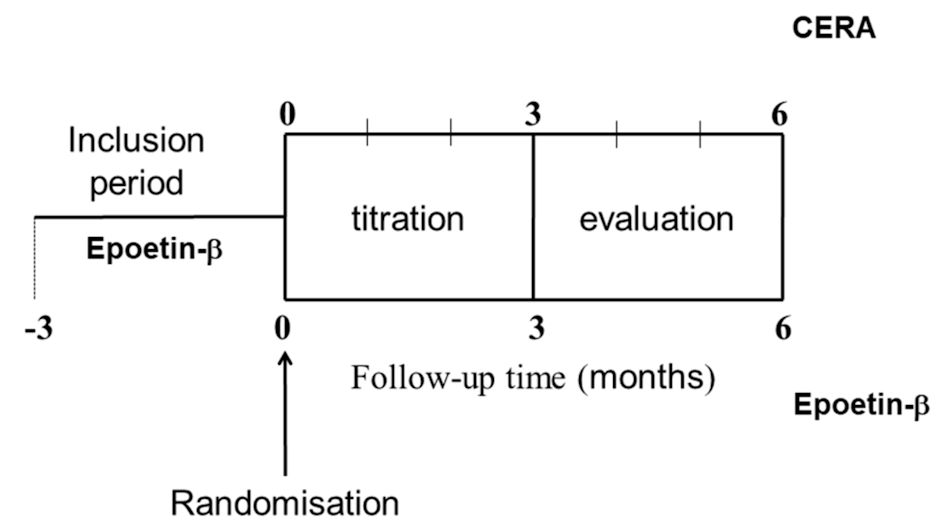
Figure 1. Study design. CERA: continuous erythropoietin receptor activator.
| Journal of Hematology, ISSN 1927-1212 print, 1927-1220 online, Open Access |
| Article copyright, the authors; Journal compilation copyright, J Hematol and Elmer Press Inc |
| Journal website https://www.thejh.org |
Original Article
Volume 10, Number 6, December 2021, pages 255-265
Monthly Continuous Erythropoietin Receptor Activator Versus Weekly Epoetin-Beta, Similar Hemoglobinization but Different Anisocytosis Degree in Hemodialysis Patients: A Randomized Controlled Trial
Figures
Tables
| EB (n = 16) | CERA (n = 15) | P | |
|---|---|---|---|
| Data are presented as mean ± standard deviation (SD), median (P25 - P75) and raw numbers (percentage). U Mann-Whitney or t-tests were used for comparing continuous variables among both groups. Categorical variables were compared using the χ2 or Fisher’s exact tests as necessary. Lanthanum carbonate and sevelamer hydrochloride were included as non-calcium chelators. Vitamin D deficiency was defined by circulating concentrations < 20 ng/mL. CERA: continuous erythropoietin receptor activator; EB: epoetin-β; BMI: body mass index; CCB: calcium channel blocker; ESR: erythrocyte sedimentation rate; iPTH: intact parathormone; nPCR: normalized protein catabolism rate; RAAS: renin-angiotensin-aldosterone system. | |||
| Age, years | 59 ± 16 | 59 ± 17 | 0.94 |
| Time in dialysis, months | 29 (19 - 45) | 32 (24 - 44) | 0.54 |
| Weight, kg | 78 ± 25 | 76 ± 15 | 0.85 |
| BMI, kg/m2 | 25 (21 - 31) | 29 (21 - 33) | 0.71 |
| Office systolic blood pressure, mm Hg | 123 ± 14 | 135 ± 18 | 0.04 |
| Office diastolic blood pressure, mm Hg | 75 ± 14 | 76 ± 15 | 0.87 |
| Kt/V | 1.5 ± 0.2 | 1.5 ± 0.2 | 0.44 |
| nPCR, g/kg/day | 0.9 ± 0.2 | 0.9 ± 0.2 | 0.52 |
| Albumin, g/L | 39 ± 4 | 39 ± 4 | 0.82 |
| Vitamin B12, pg/mL | 574 (385 - 717) | 402 (290 - 512) | 0.14 |
| Folic acid, ng/mL | 19 (2 - 40) | 19 (5 - 32) | 0.74 |
| C-reactive protein, mg/dL | 0.65 (0.43 - 1.90) | 0.86 (0.24 - 1.26) | 0.45 |
| ESR, mm/h | 31 ± 24 | 31 ± 21 | 0.96 |
| Corrected calcium, mg/dL | 9 ± 0.4 | 8.9 ± 0.4 | 0.6 |
| Phosphorus, mg/dL | 3.8 ± 1.2 | 4.4 ± 1.3 | 0.12 |
| iPTH, pg/mL | 228 ± 121 | 333 ± 196 | 0.12 |
| 25 (OH) vitamin D, ng/mL | 17 (11 - 35) | 25 (14 - 32) | 0.52 |
| 1,25 (OH)2 vitamin D, pg/mL | 15 (9 - 20) | 17 (13 - 23) | 0.32 |
| Comorbidities | |||
| Arterial hypertension, n (%) | 13 (46) | 15 (54) | 0.22 |
| Diabetes mellitus, n (%) | 4 (40) | 6 (60) | 0.45 |
| Dyslipidemia, n (%) | 4 (40) | 9 (60) | 0.21 |
| Vitamin D deficiency, n (%) | 7 (54) | 6 (46) | 0.71 |
| Smoking patients, n (%) | 3 (33) | 6 (67) | 0.25 |
| Concomitant treatments | |||
| Calcifediol, n (%) | 8 (47) | 9 (53) | 0.57 |
| Paricalcitol, n (%) | 11 (48) | 12 (52) | 0.68 |
| Cinacalcet, n (%) | 3 (30) | 7 (70) | 0.13 |
| RAAS inhibitors, n (%) | 6 (54) | 5 (46) | 0.43 |
| CCB, n (%) | 5 (50) | 5 (50) | 0.9 |
| Calcium acetate, n (%) | 4 (33) | 8 (67) | 0.1 |
| Non-calcium chelator, n (%) | 13 (57) | 10 (43) | 0.43 |
| EB (n = 16) | CERA (n = 15) | P | |
|---|---|---|---|
| Data are presented as mean ± standard deviation (SD), median (P25 - P75) and raw numbers (percentage). U Mann-Whitney or t-tests were used for comparing continuous variables among both groups. Categorical variables were compared using the χ2 or Fisher’s exact tests as necessary. Total iron deficit was calculated as follows: (10 × (target Hb (g/dL) - actual Hb (g/dL)) × (0.24 × bodyweight (kg))) + mg of iron for body stores, where mg of iron for body stores were 0 mg if bodyweight < 35 kg and 500 mg if bodyweight ≥ 35 kg. The erythropoietin resistance index (ERI) was determined as the weekly weight-adjusted dose of EPO (IU/kg/week) divided by Hb concentration (g/dL). CERA: continuous erythropoietin receptor activator; EB: epoetin-β; Fe: serum iron; IV: intravenous; Hb: hemoglobin; RDW: red cell distribution width; TSAT: transferrin saturation index; EPO: erythropoietin. | |||
| Hb, g/dL | 11.9 ± 0.8 | 11.7 ± 1.0 | 0.48 |
| Erythrocyte count, ×106/µL | 3.69 ± 0.30 | 3.63 ± 0.31 | 0.61 |
| RDW, % | 13.5 ± 1.1 | 13.0 ± 0.8 | 0.21 |
| Fe, µg/dL | 54 (51 - 75) | 73 (68 - 85) | 0.02 |
| TSAT, % | 25 (22 - 33) | 28 (21 - 38) | 0.18 |
| Ferritin, ng/mL | 675 (433 - 1,123) | 860 (529 - 1,042) | 0.54 |
| Transferrin, mg/dL | 157 (144 - 183) | 166 (143 - 251) | 0.40 |
| Total iron deficit calculated, mg | 1,559 ± 310 | 1,566 ± 344 | 0.95 |
| EB dosage, IU/week | 7,000 ± 3,204 | 6,200 ± 4,195 | 0.55 |
| ERI, IU/kg /week | 9.0 ± 6.8 | 7.4 ± 5.7 | 0.48 |
| IV iron supplementation, n (%) | 16 (100) | 9 (60) | < 0.01 |
| ESA type: (n = 16)/CERA (n = 15) | Months of follow-up | F | P | Partial η2 | ||
|---|---|---|---|---|---|---|
| 0 | 3 | 6 | ||||
| Values are given as mean (standard deviation (SD)). aP < 0.05 respect to baseline. bP < 0.05 after iron adjustment. CERA: continuous erythropoietin receptor activator; EB: epoetin-β; ESA: erythropoietin-stimulating agent; Fe: serum iron; TIDC: total iron deficit calculated; TSAT: transferrin saturation index. | ||||||
| TSAT, % | ||||||
| EB | 26 ± 6 | 24 ± 7 | 30 ± 19 | 0.98 | 0.38 | |
| CERA | 35 ± 17 | 36 ± 14 | 29 ± 14 | 1.18 | 0.32 | |
| Ferritin, ng/mL | ||||||
| EB | 755 ± 397 | 707 ± 439 | 632 ± 343 | 0.78 | 0.45 | |
| CERA | 879 ± 542 | 783 ± 443 | 561 ± 301a | 7.17 | < 0.01b | 0.33 |
| Transferrin, mg/dL | ||||||
| EB | 161 ± 30 | 162 ± 22 | 158 ± 24 | 0.25 | 0.77 | |
| CERA | 183 ± 50 | 172 ± 37 | 164 ± 35a | 3.39 | 0.04 | 0.19 |
| Fe, µg/dL | ||||||
| EB | 59 ± 16 | 55 ± 15 | 67 ± 38 | 0.77 | 0.46 | |
| CERA | 83 ± 33 | 83 ± 35 | 64 ± 27 | 1.81 | 0.18 | |
| TIDC, mg | ||||||
| EB | 1,559 ± 310 | 1,565 ± 337 | 1,580 ± 299 | 0.05 | 0.95 | |
| CERA | 1,566 ± 344 | 1,609 ± 382 | 1,600 ± 364 | 0.19 | 0.82 | |
| ESA type | Month 3 | Month 6 | P |
|---|---|---|---|
| Data are presented as median (P25 - P75). *P < 0.05 respect to EB. α-Klotho: soluble α-Klotho; CERA: continuous erythropoietin receptor activator; EB: epoetin-β; EPO: erythropoietin; ESA: erythropoietin-stimulating agent. | |||
| Hepcidin, pg/mL | |||
| EB | 995 (244 - 1,308) | 1,103 (161 - 1,345) | 0.95 |
| CERA | 1,094 (234 - 1,390) | 215 (157 - 922) | 0.02 |
| EPO, mIU/mL | |||
| EB | 7.7 (4.1 - 11.6) | 12.1 (4.1 - 22.4) | 0.09 |
| CERA | 13.3 (10.8 - 17.1)* | 22.6 (14.5 - 41.9)* | 0.08 |
| α-Klotho, pg/mL | |||
| EB | 514 (417 - 584) | 493 (370 - 526) | 0.01 |
| CERA | 540 (455 - 741) | 409 (360 - 534) | 0.03 |
| All patients (n = 37) | Epoetin-β (n = 19) | CERA (n = 18) | P | |
|---|---|---|---|---|
| aVascular access complication, fistula or catheter thrombosis, post-dialysis site bleeding. AE: adverse event; SAE: serious adverse event; CERA: continuous erythropoietin receptor activator. | ||||
| AE, n (%) | 21 | 7 (33) | 14 (67) | < 0.01 |
| Required transfusion(s), n (%) | 1 | 0 | 1 (100) | 1.00 |
| Any SAE, n (%) | 7 | 1 (14) | 6 (86) | 0.04 |
| Vascular access complicationsa | 6 | 2 (33) | 4(67) | 0.40 |
| Suspected adverse reaction | 7 | 2 (29) | 5 (71) | 0.39 |
| Death, n (%) | 2 | 0 | 2 (100) | 0.22 |