Journal of Hematology, ISSN 1927-1212 print, 1927-1220 online, Open Access
Article copyright, the authors; Journal compilation copyright, J Hematol and Elmer Press Inc
Journal website https://www.thejh.org

Original Article

Volume 10, Number 4, August 2021, pages 178-186


Azithromycin Reduces Markers of Vascular Damage in Pediatric Patients With Sickle Cell Disease

Figures

Figure 1.
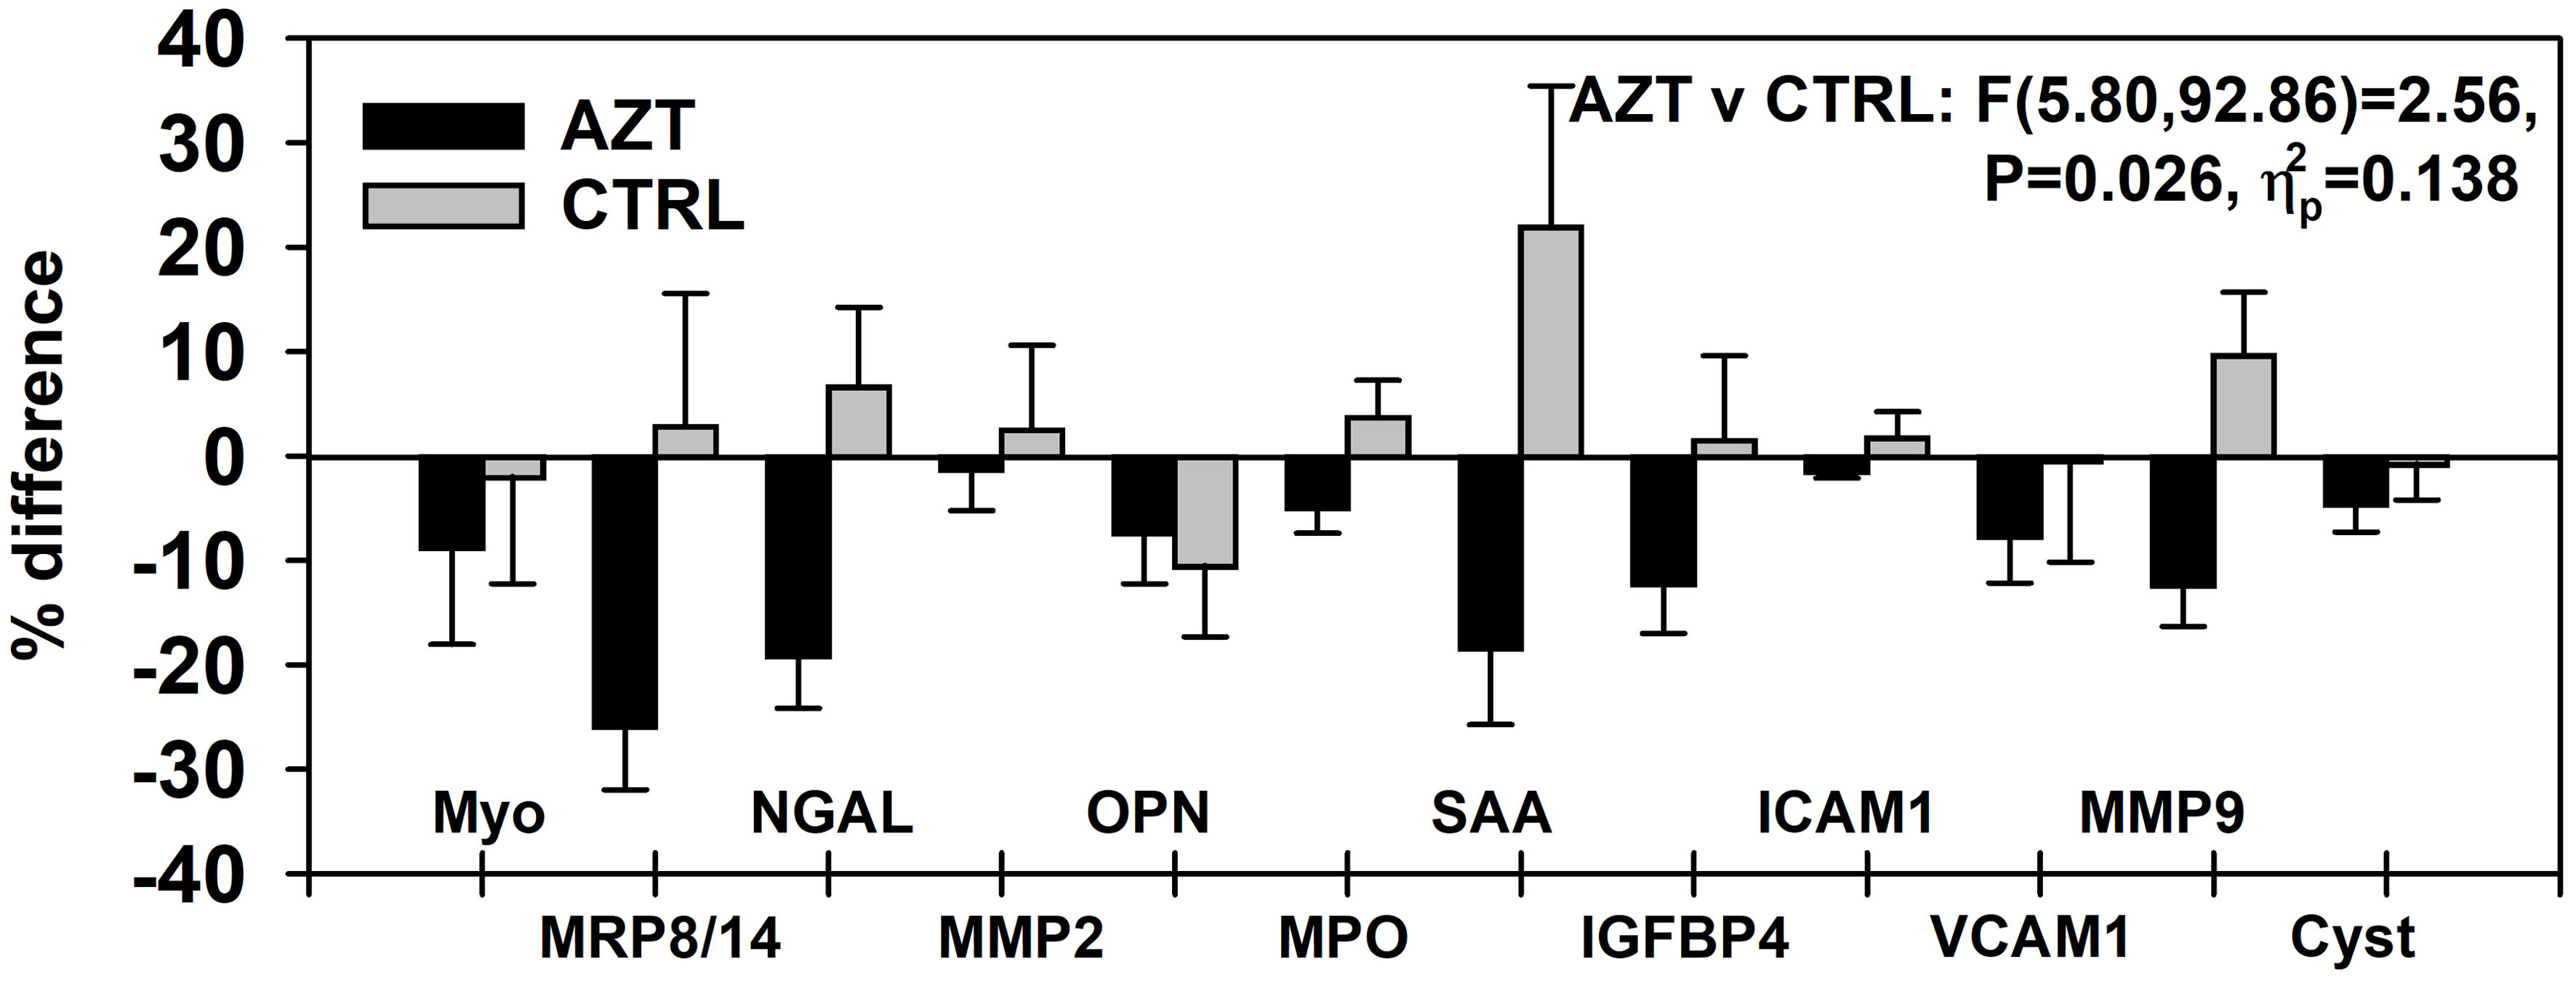
Figure 1. Dynamics of changes in plasma levels of all studied markers of vascular damage in patients treated with azithromycin (AZT) and placebo control (CTRL) groups. Data were analyzed with mixed-model repeated measures analysis of variance (ANOVA) and presented as a percent difference between PRE and POST intervals. MRP: myeloid-related protein; NGAL: lipocalin A; MMP: matrix metalloproteinase; IGFBP: insulin-like growth factor-binding protein; OPN: osteopontin; MPO: myeloperoxidase; SAA: serum amyloid A; ICAM: intercellular adhesion molecule; VCAM: vascular cell adhesion molecule; Cyst: cystatin.
Figure 2.
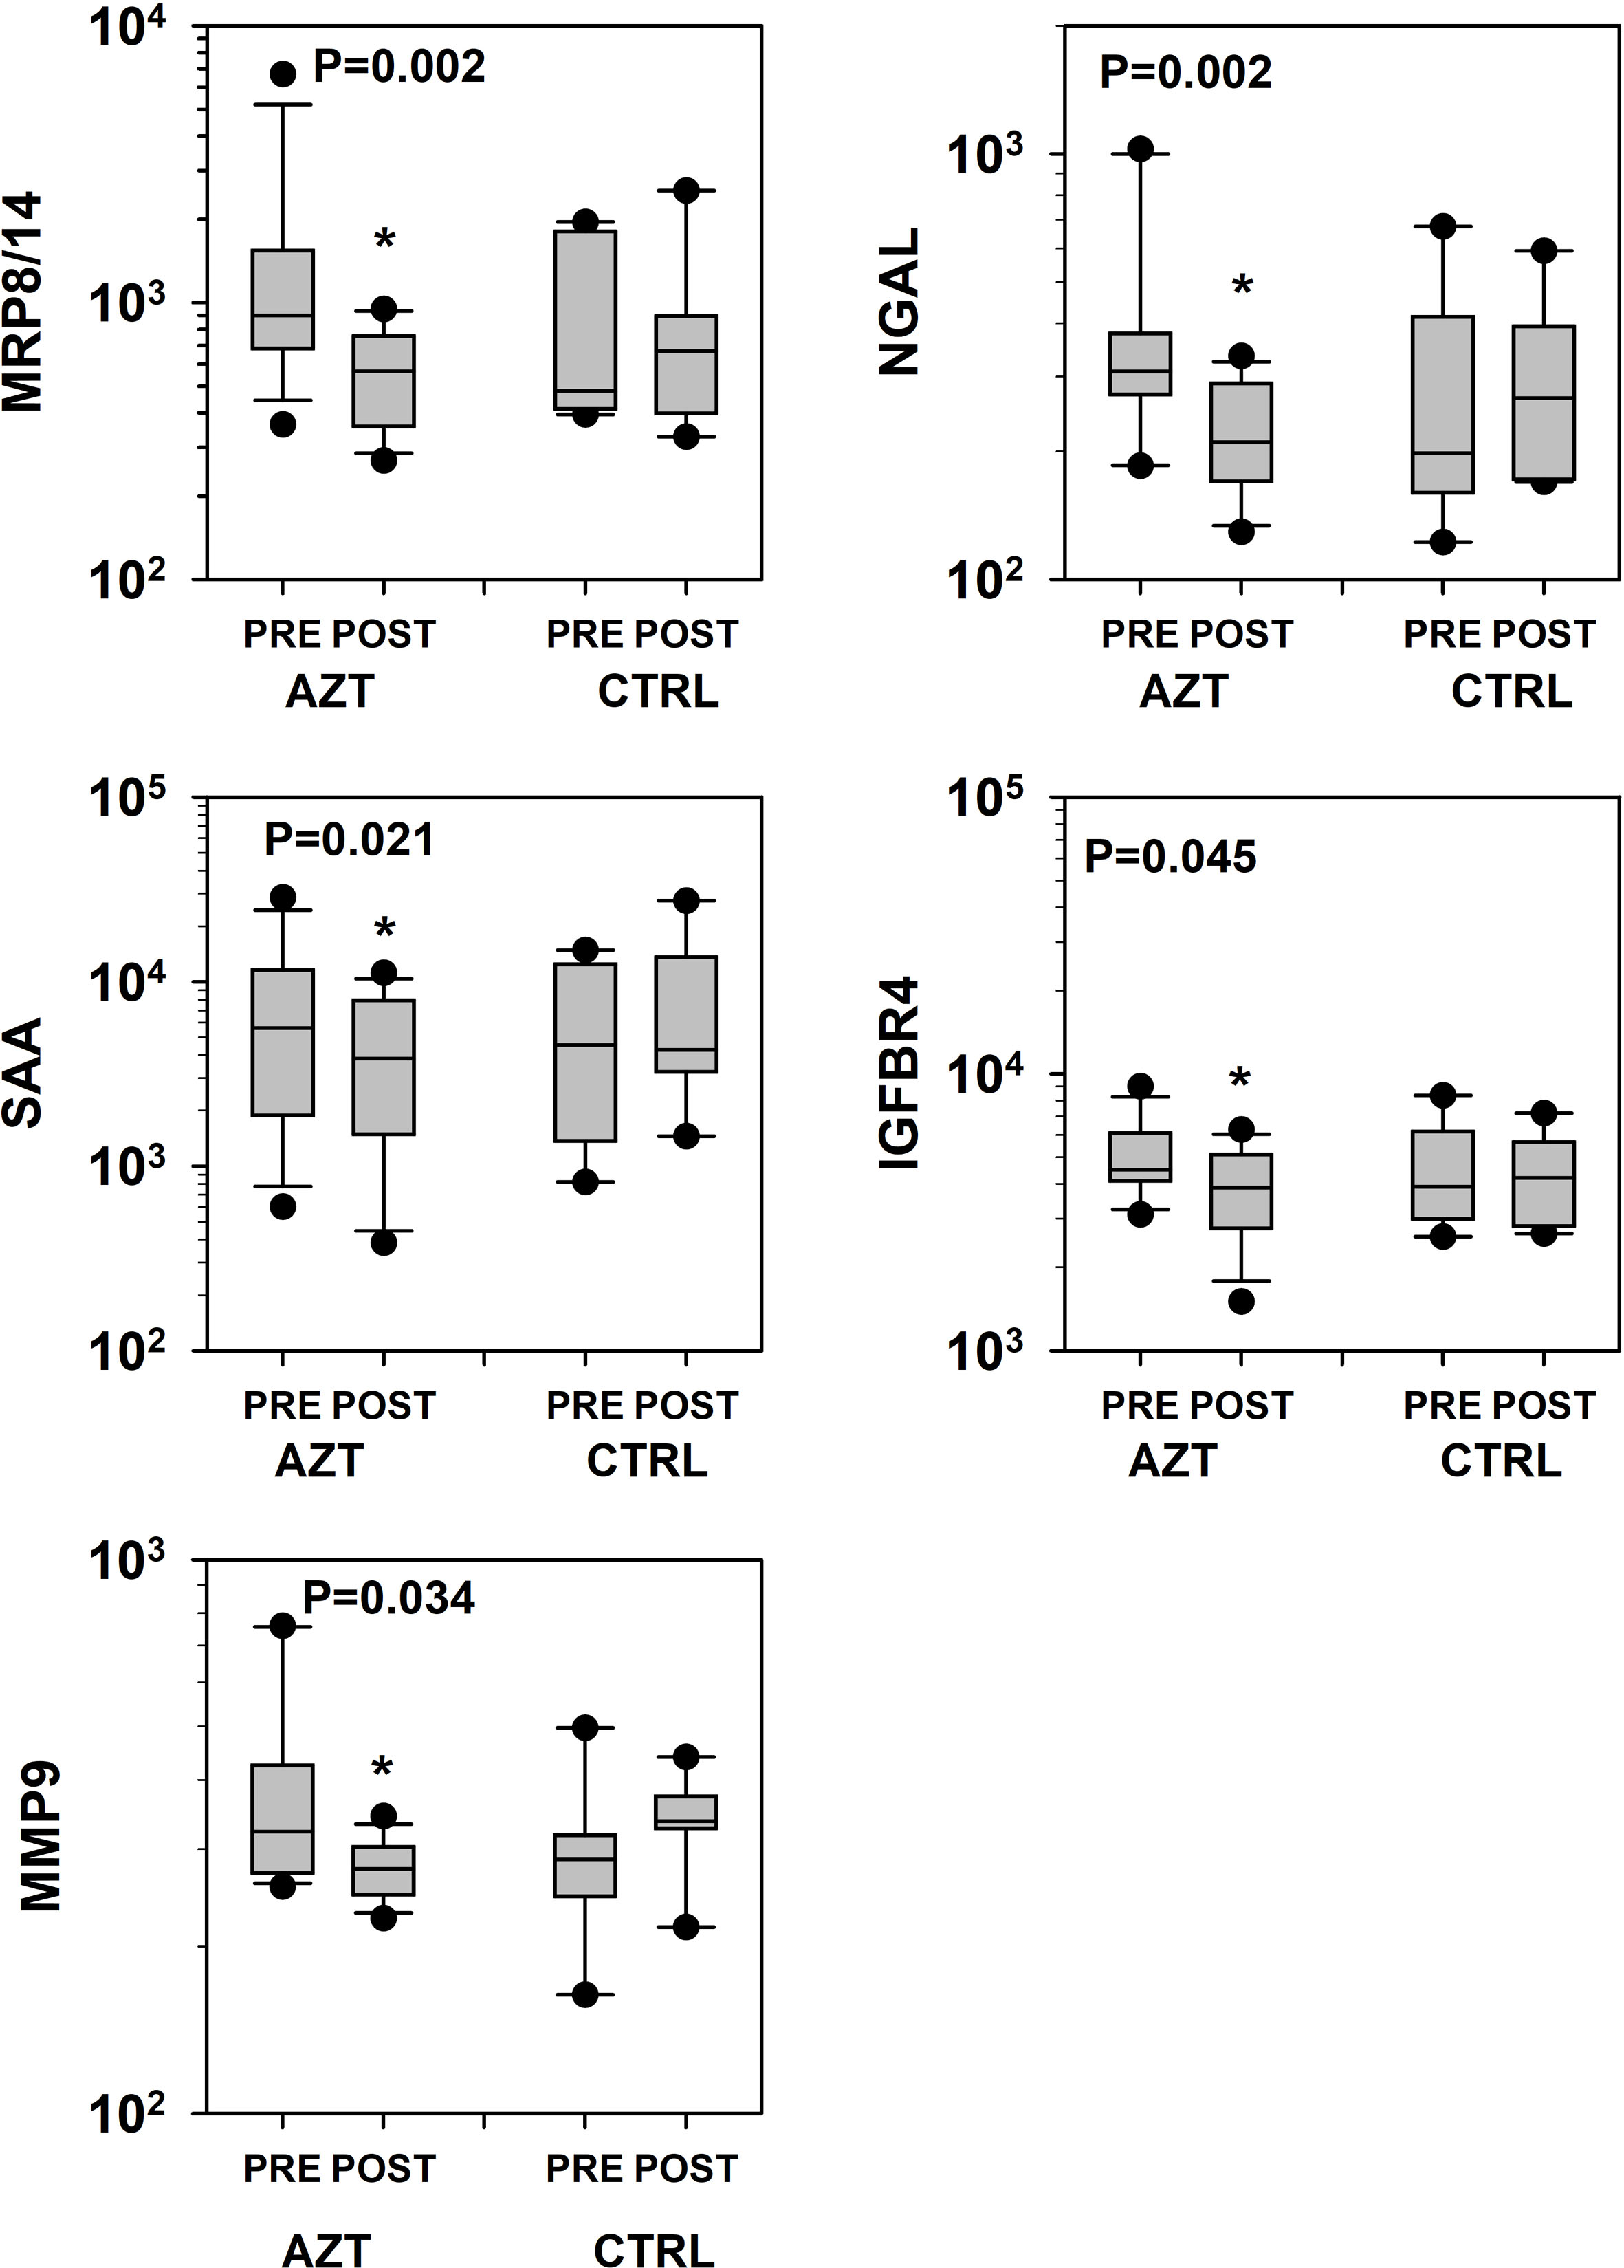
Figure 2. Dynamics of changes in plasma levels of specific markers of vascular damage that revealed statistical significance in patients treated with azithromycin (AZT) and placebo control (CTRL) groups. Data was analyzed with mixed-model repeated measures analysis of variance (ANOVA) followed by the pairwise multiple comparison procedures (Holm-Sidak method). *Statistical significance between PRE and POST intervals. MRP: myeloid-related protein; NGAL: lipocalin A; MMP: matrix metalloproteinase; IGFBP: insulin-like growth factor-binding protein; SAA: serum amyloid A.
Figure 3.
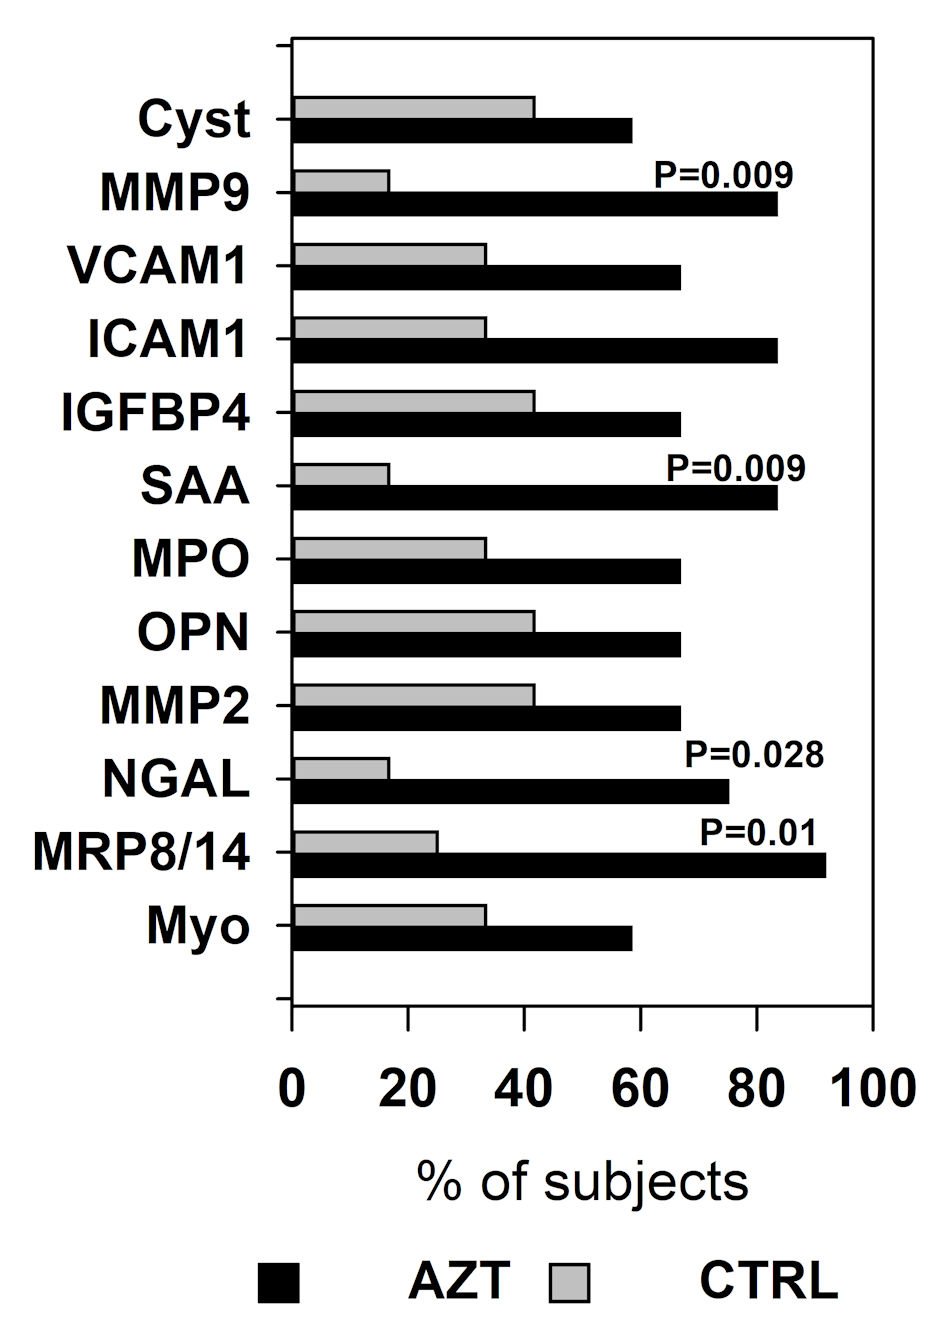
Figure 3. Percentage of the patients in azithromycin (AZT) and placebo control (CTRL) groups whose plasma level decreased at POST interval compared to PRE. Data were analyzed with χ2 test with Yates correction for continuity. MRP: myeloid-related protein; NGAL: lipocalin A; MMP: matrix metalloproteinase; IGFBP: insulin-like growth factor-binding protein; OPN: osteopontin; MPO: myeloperoxidase; SAA: serum amyloid A; ICAM: intercellular adhesion molecule; VCAM: vascular cell adhesion molecule; Cyst: cystatin.

Tables

Table 1. Demographic Data of the Subjects
 
AZT groupCTRL groupP value
AZT: azithromycin; CTRL: placebo control; F: female; M: male; SD: standard deviation.
Age (mean ± SD)10.7 ± 3.310.6 ± 3.20.978
Gender (F/M), n7/53/50.361
Diagnosis (Hb (SB+/SC/SS)), n2/4/61/1/60.499


Table 2. Relative Distribution and Absolute Numbers of the Major Populations of White Blood Cells in Peripheral Blood in Patients Treated With Azithromycin (AZT) and Placebo Control (CTRL) Groups
 
AZTCTRL
PREPOSTPREPOST
Data were presented as mean ± standard error of the mean (SEM). *Statistical significance (P < 0.05) between PRE and POST intervals. LEU: leukocytes; GR: granulocytes; LY: lymphocytes; MO: monocytes.
LEU
  × 103 cells/µL9,633.3 ± 1,252.07,618.3 ± 973.7*9,025.0 ± 1,653.810,562.5 ± 1,277.4*
GR
  %53.5 ± 4.244.9 ± 4.0*43.2 ± 5.951.4 ± 3.7*
  × 103 cells/µL5,275.0 ± 1,054.73,566.7 ± 491.8*4,062.5 ± 841.35,437.5 ± 663.0*
LY
  %39.3 ± 4.047.1 ± 3.4*48.7 ± 5.943.1 ± 3.7
  × 103 cells/µL3,566.2 ± 426.03,692.2 ± 704.74,448.7 ± 1,184.94633.4 ± 859.2
MO
  %6.5 ± 0.97.7 ± 1.36.7 ± 0.45.3 ± 0.5*
  × 103 cells/µL642.8 ± 123.7582.3 ± 117.1626.3 ± 141.8570.2 ± 103.3


Table 3. Relative Distribution of the T Cell Subsets in Peripheral Blood of Patients Treated With Azithromycin (AZT) and Placebo Control (CTRL) Groups
 
AZTCTRL
PREPOSTPREPOST
Data were presented as mean ± standard error of the mean (SEM). *Statistical significance (P < 0.05) between PRE and POST intervals. CD: cluster of differentiation.
CD3+ (%)57.5 ± 2.762.3 ± 1.9*60.7 ± 3.262.1 ± 2.2
CD3-CD56+ (%)11.5 ± 1.910.9 ± 1.48.7 ± 1.19.8 ± 1.0
CD3+CD4+ (%)66.3 ± 1.668.6 ± 1.3*66.4 ± 1.866.3 ± 1.8
CD3+CD8+ (%)25.4 ± 1.628.7 ± 1.6*26.7 ± 2.225.1 ± 2.4