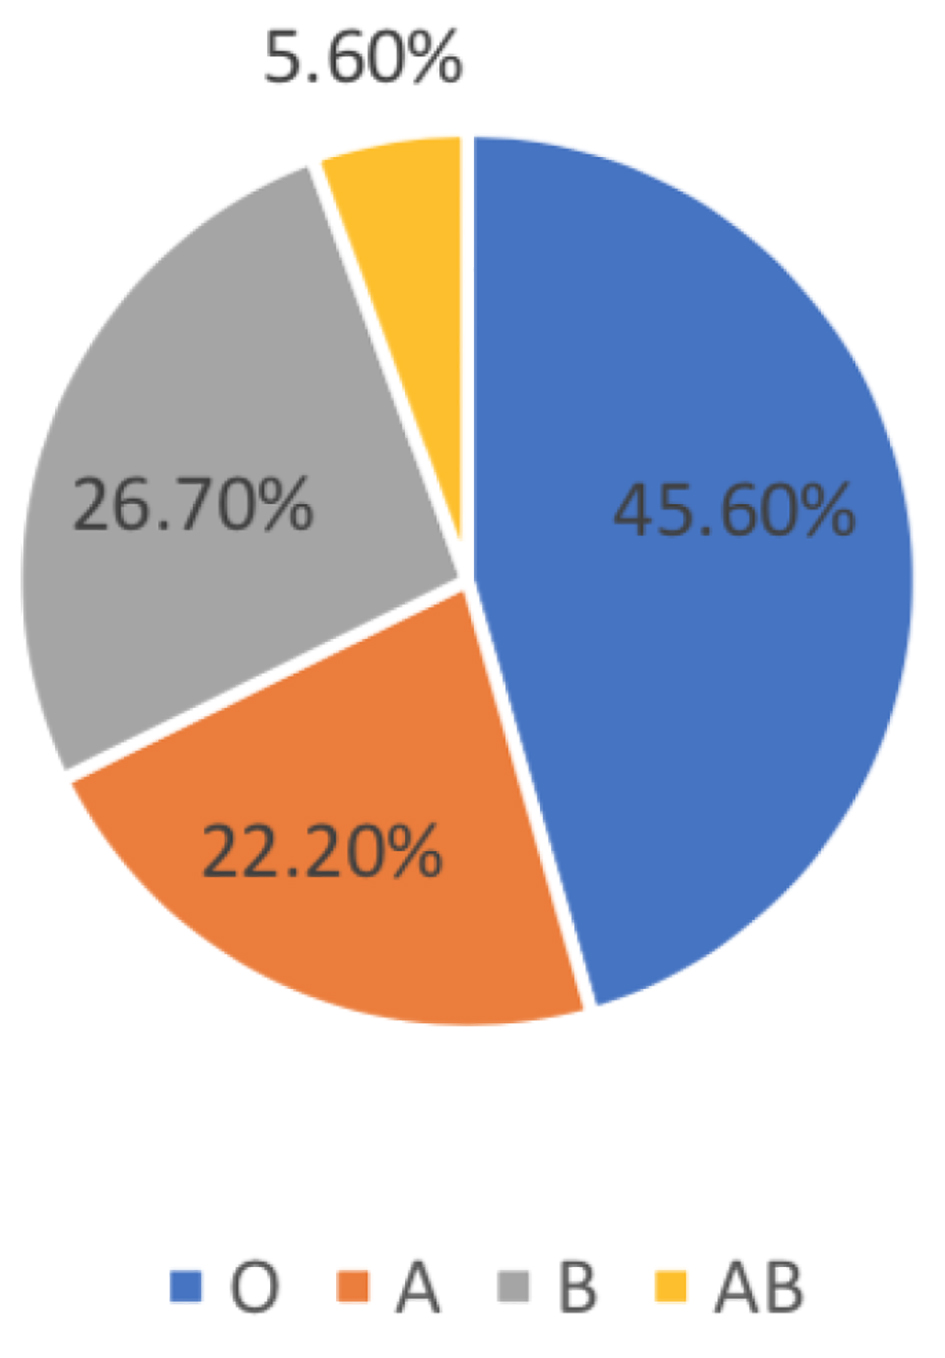
Figure 1. Distribution of blood groups.
| Journal of Hematology, ISSN 1927-1212 print, 1927-1220 online, Open Access |
| Article copyright, the authors; Journal compilation copyright, J Hematol and Elmer Press Inc |
| Journal website https://www.thejh.org |
Original Article
Volume 10, Number 2, April 2021, pages 64-70
ABO in Correlation to the Requirement of Mechanical Ventilation and Mortality in Critically Ill Patients With COVID-19
Figures
Tables
| Clinical status | Suggested action |
|---|---|
| COVID-19: coronavirus disease 2019. | |
| Respiratory rate ≥ 20 bpm with SpO2 ≤ 94% | Administer O2 < 40% by face mask, if SpO2 rises to > 94%, observe and monitor |
| Respiratory rate ≥ 20 bpm with SpO2 ≤ 94% on FiO2 ≥ 40% | Start 15 L/min O2 via non-rebreathing mask. Senior clinical review to consider: a trial of continuous positive airway pressure, if appropriate mental status and able to tolerate well-fitted non-vented face mask. |
| Respiratory rate ≥ 20 bpm with SpO2 ≤ 94% on 15 L/min O2 via non-rebreathing mask and/or patient unable to tolerate continuous positive airway pressure, obtunded/disoriented, rising FiO2 needs, significant clinical decline | Urgent critical care review |
| Blood group | Provincial (n =57,396), % | National (n = 35,388), % | ICU sample (n = 90), % | ICU vs. provincial, P value | ICU vs. national, P value |
|---|---|---|---|---|---|
| COVID-19: coronavirus disease 2019; ICU: intensive care unit. | |||||
| O | 52% | 50.1% | 45.6% | 0.888 | 0.898 |
| A | 26% | 29.7% | 22.2% | ||
| B | 18% | 16% | 26.7% | ||
| AB | 4% | 4.1% | 5.6% | ||
| Blood groups | P-value | ||
|---|---|---|---|
| O/B (N = 65) | A/AB (N = 25) | ||
| *P ≤ 0.05. | |||
| Demographic data | |||
| Age, mean (SD) | 58.91 (13.71) | 57.52 (14.17) | 0.671 |
| Gender | |||
| Male, N (%) | 44 (67.7%) | 18 (72.0%) | 0.693 |
| Female, N (%) | 21 (32.3%) | 7 (28.0%) | |
| Comorbidities | |||
| Diabetic mellitus | 35 (53.8%) | 17 (68.0%) | 0.223 |
| Hypertension | 40 (61.5%) | 17 (68.0%) | 0.569 |
| Dyslipidemia | 6 (9.2%) | 0 (0.0%) | 0.116 |
| Cardiac diseases | 13 (20.0%) | 5 (20.0%) | 1.0 |
| Renal dysfunction | 14 (21.5%) | 6 (24.0%) | 0.801 |
| Pulmonary dysfunction | 6 (9.2%) | 1 (4.0%) | 0.407 |
| Obesity | 7 (10.8%) | 3 (12.0%) | 0.868 |
| Other | 21 (32.3%) | 8 (32.0%) | 0.978 |
| Laboratory results | |||
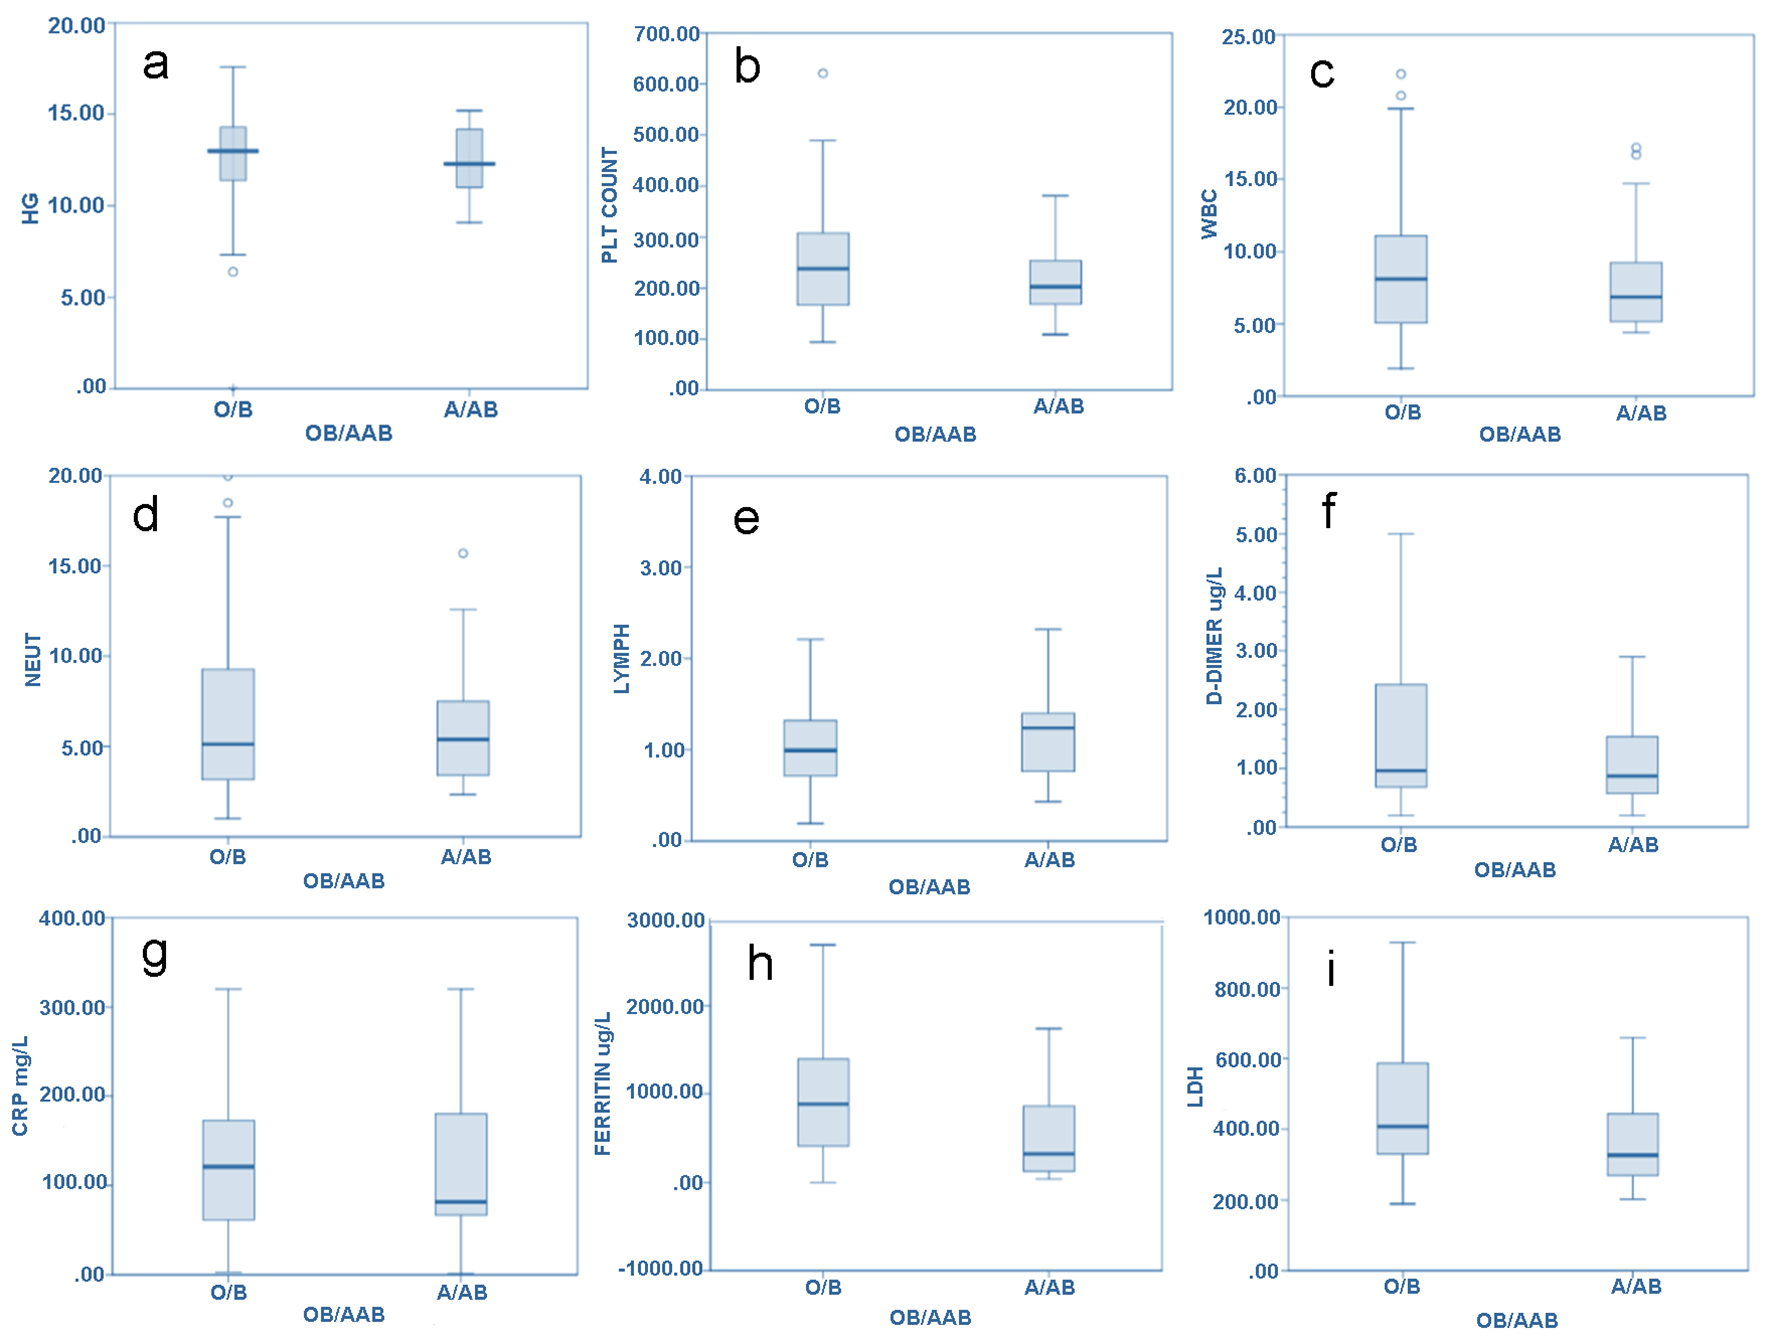
| Hemoglobin, mean (SD) | 12.43 (2.88) | 12.41 (1.81) | 0.975 |
| Platelet count, mean (SD) | 250.82 (103.4) | 215.88 (70.99) | 0.124 |
| White blood cell count, mean (SD) | 8.83 (4.84) | 8.11 (3.78) | 0.507 |
| Neutrophil count, mean (SD) | 6.75 (4.65) | 6.17 (3.44) | 0.571 |
| Lymphocyte count, mean (SD) | 1.17 (0.70) | 1.22 (0.61) | 0.769 |
| D-dimer, mean (SD) | 3.10 (6.92) | 2.44 (4.85) | 0.664 |
| C-reactive protein, mean (SD) | 126.10 (80.04) | 123.35 (87.71) | 0.887 |
| Ferritin, mean (SD) | 1,017.14 (867.6) | 611.01 (637.04) | 0.036* |
| Lactate dehydrogenase, mean (SD) | 487.04 (324.98) | 371.18 (147.04) | 0.09 |
| Blood groups | Statics | ||||||
|---|---|---|---|---|---|---|---|
| O/B | A/AB | Paired correlation, P-value | t-test, P-value | Competing risks regression model (O/B considered control group) | |||
| OR | 95% CI | P-value | |||||
| *P ≤ 0.05. SD: standard deviation; ICU: intensive care unit; OR: odds ratio; CI: confidence interval. | |||||||
| Hospital length of stay, mean (SD) | 18.46 (15.11) | 23.40 (17.13) | 0.185 | 0.00* | - | - | - |
| ICU length of stay, mean (SD) | 12.63 (13.1) | 18.20 (15.9) | 0.033* | 0.00* | - | - | - |
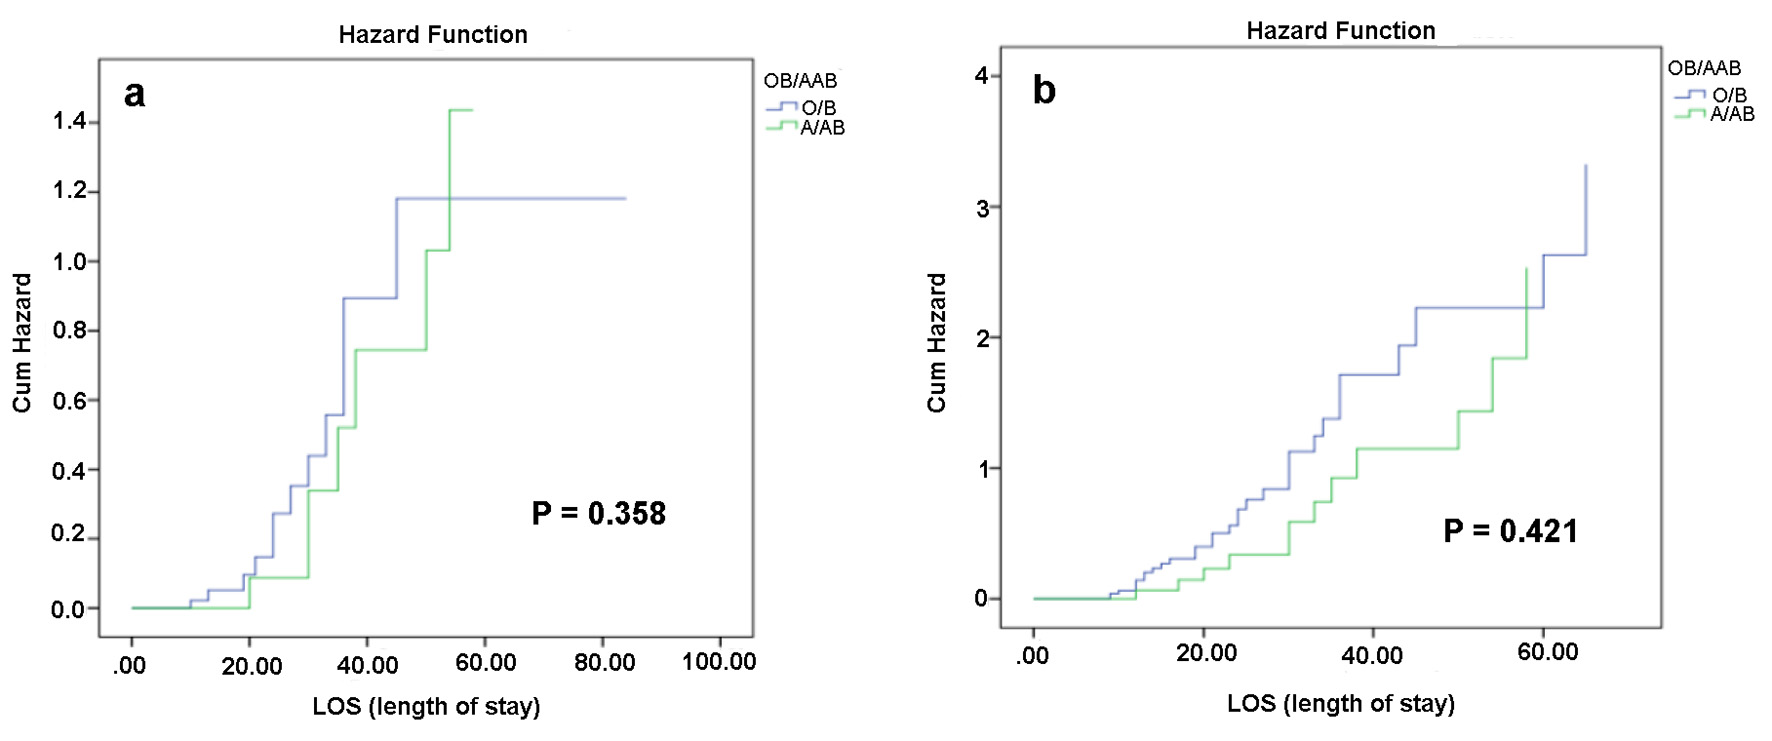
| Intubation, N (%) | 32 (49.2%) | 13 (52.0%) | 0.055 | 0.08 | 1.12 | 0.44 - 2.8 | 0.814 |
| Days of intubation, mean (SD) | 7.62 (11.18) | 8.08 (9.26) | 0.854 | 0.19 | - | - | - |
| End results | |||||||
| Death, N (%) | 12 (18.5%) | 8 (32.0%) | 0.166 | 0.00* | 2.07 | 0.72 - 5.92 | 0.1713 |
| Recovery, N (%) | 53 (81.5%) | 17 (68.0) | |||||
| APACHE II score, mean (SD) | 13.11 (8.65) | 14.24 (8.7) | 0.580 | 0.00* | - | - | - |
| Mortality, mean (SD) | 20.12 (17.92) | 22.72 (23.36%) | 0.574 | 0.00* | - | - | - |