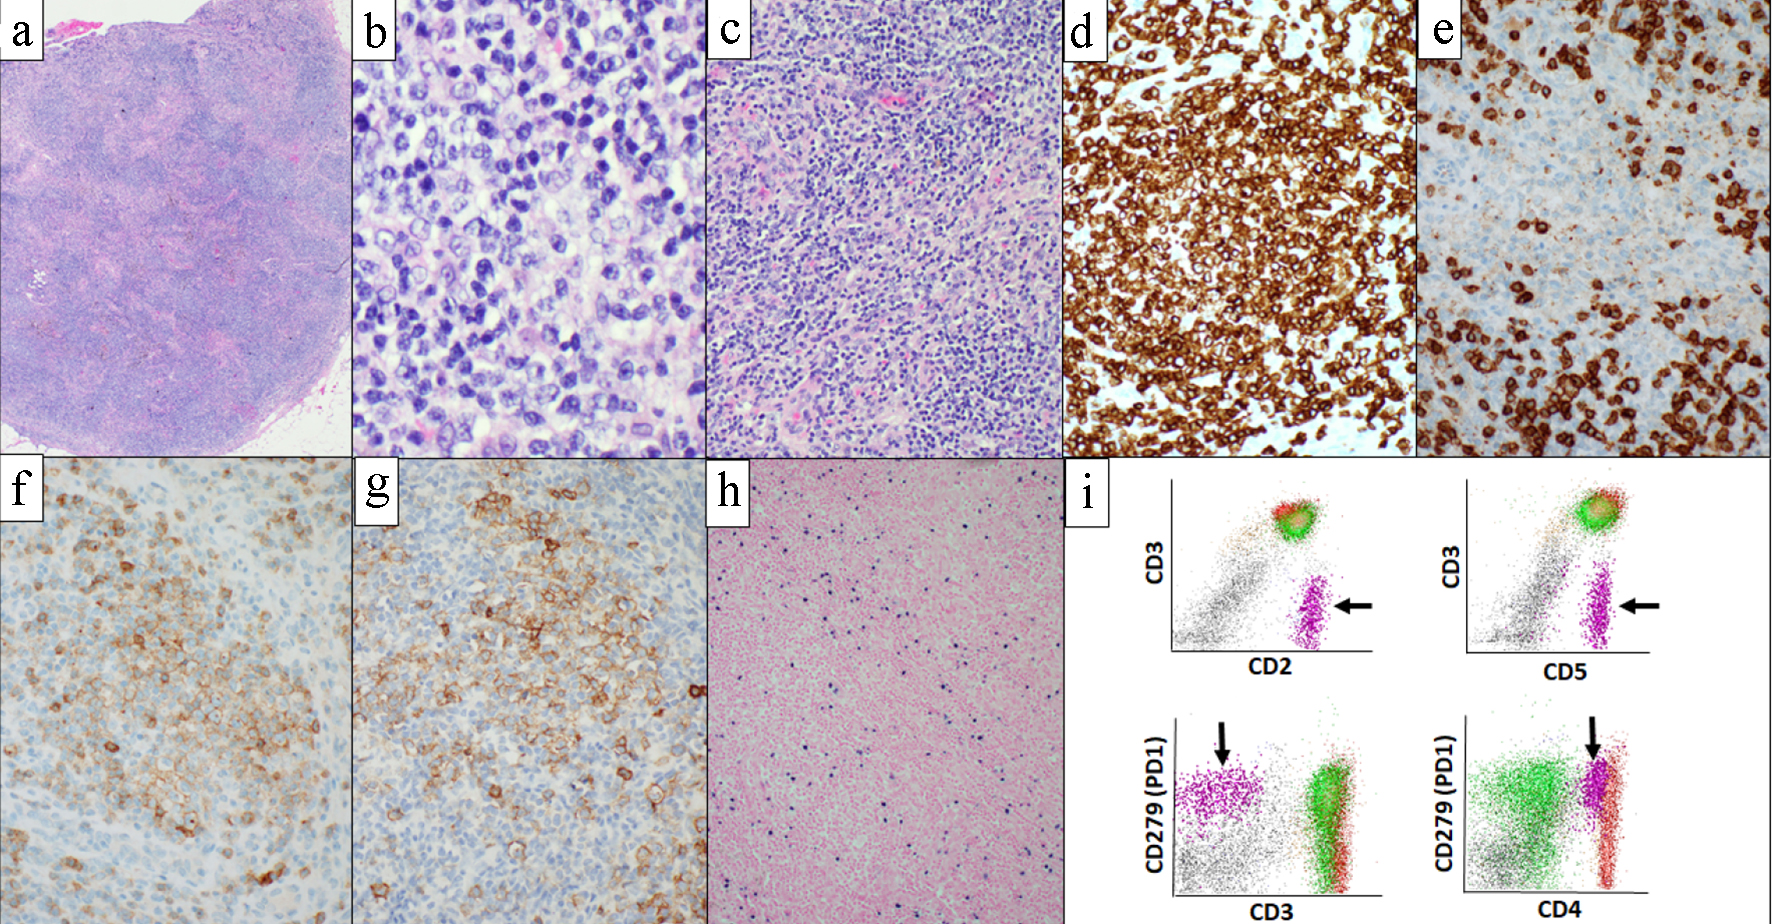
Figure 1. Level 4 lymph nodes biopsy and corresponding flow cytometric analysis. Histologic section showed lymphoid tissue with effacement of normal nodal architecture (a). Abnormal lymphocytes had irregular nuclear contours, condensed chromatin, occasional small nucleoli and moderate amount of clear cytoplasm (b). Small lymphocytes, histiocytes and vascular proliferation were present in a background (c). Lymphoma cells are highlighted with CD3 (d), show aberrant loss of CD7 (e) and express TFH markers; PD1 (f) and ICOS (g). EBER in situ hybridization highlighted many cells throughout the specimen (h). Flow cytometric analysis performed with the level 4 lymph nodes biopsy identified abnormal T-cell population (black arrow) showing loss of surface CD3 and bright expression of PD1 (i). (a-c) Hematoxylin and eosin; (d) CD3 immunohistochemistry; (e) CD7 immunohistochemistry; (f) PD1 immunohistochemistry; (g) ICOS immunohistochemistry; (h) EBER in situ hybridization. EBER: Epstein-Barr encoding region.
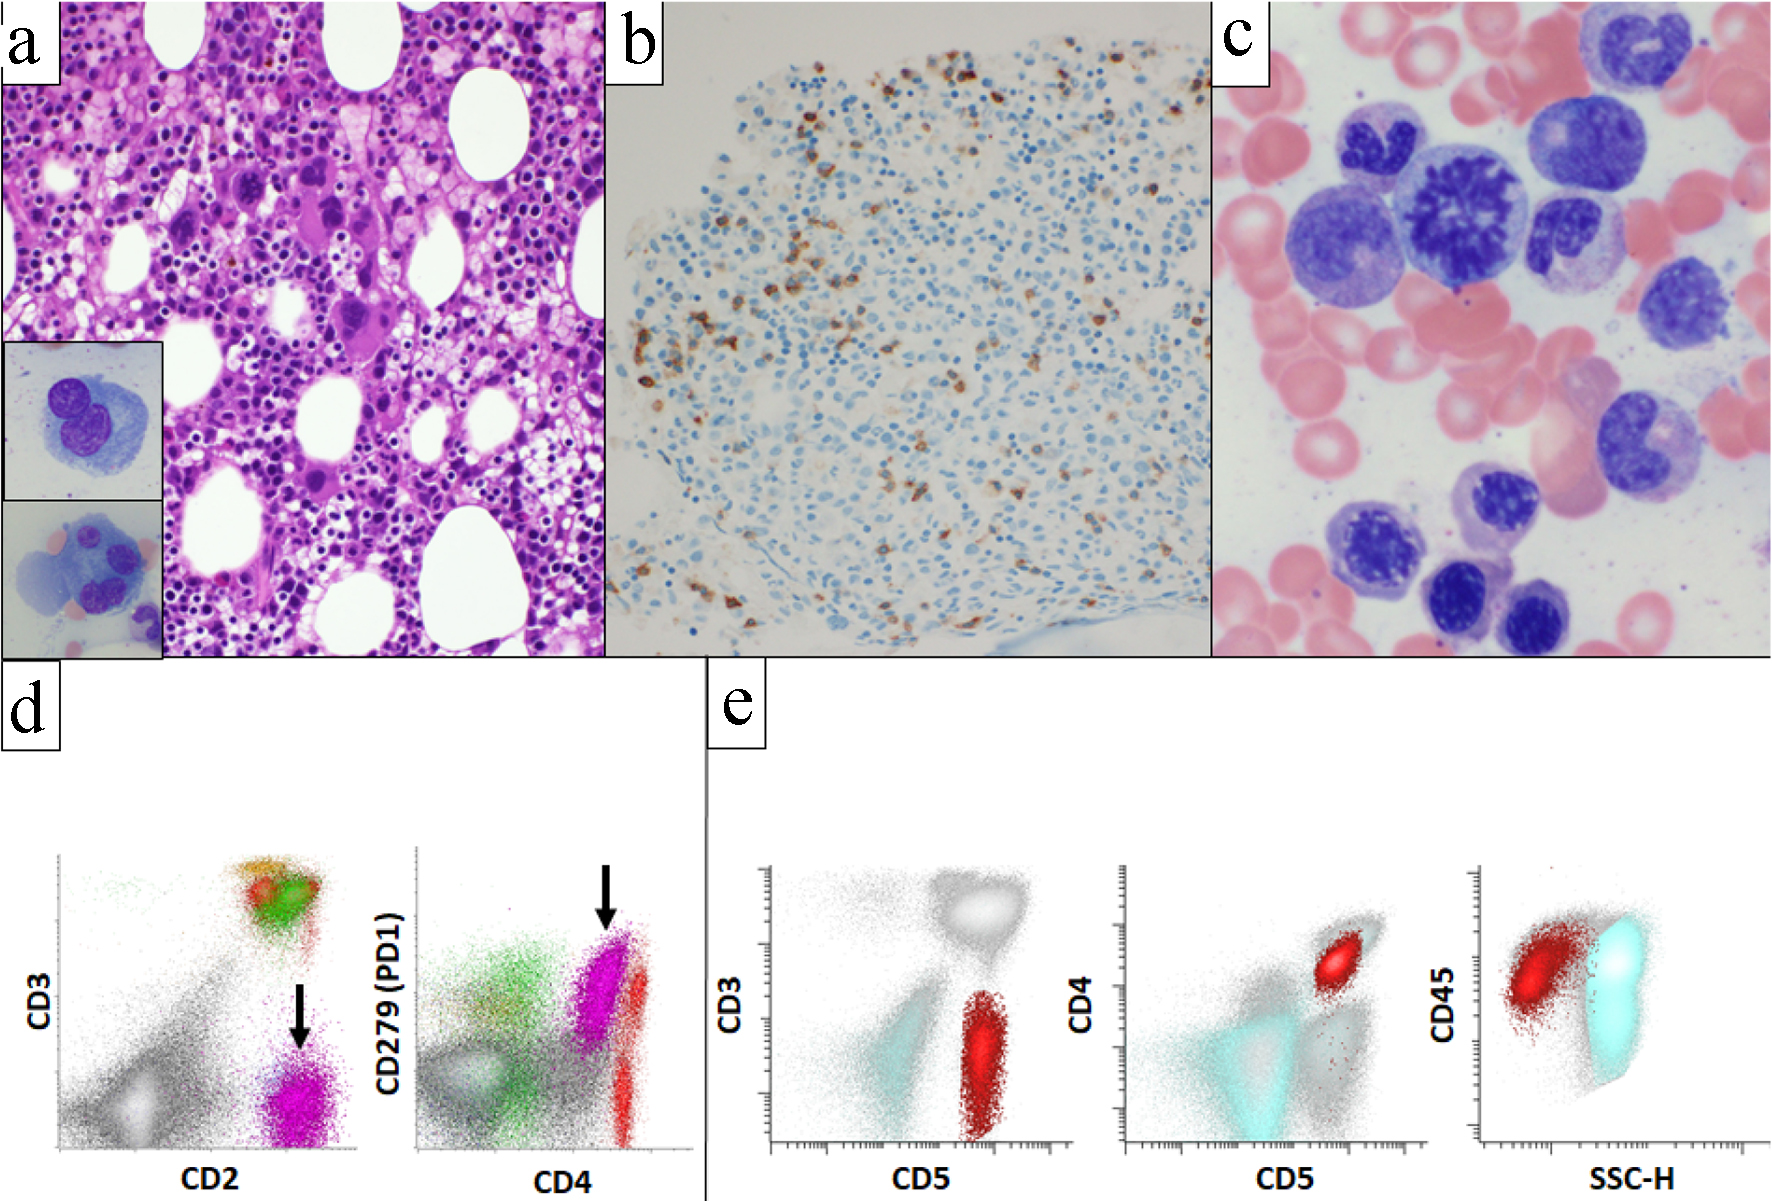
Figure 2. Bone marrow biopsy, aspirate, and corresponding flow cytometric analysis. Bone marrow was hypercellular for age (50-60% cellularity) and showed erythroid-predominant trilineage hematopoiesis with dysplastic features in megakaryocytes (a). PD1 immunohistochemistry highlighted scattered PD1-positive cells (b). Erythroid precursors occasionally showed megaloblastoid changes (c). Flow cytometric analysis identified an abnormal T-cell population (black arrow) showing the same immunophenotype with the AITL in mediastinal lymph nodes (d). Flow sorting was performed to separate abnormal T-cell population (red) from myeloid cell population (aqua) (e). AITL: angioimmunoblastic T-cell lymphoma.
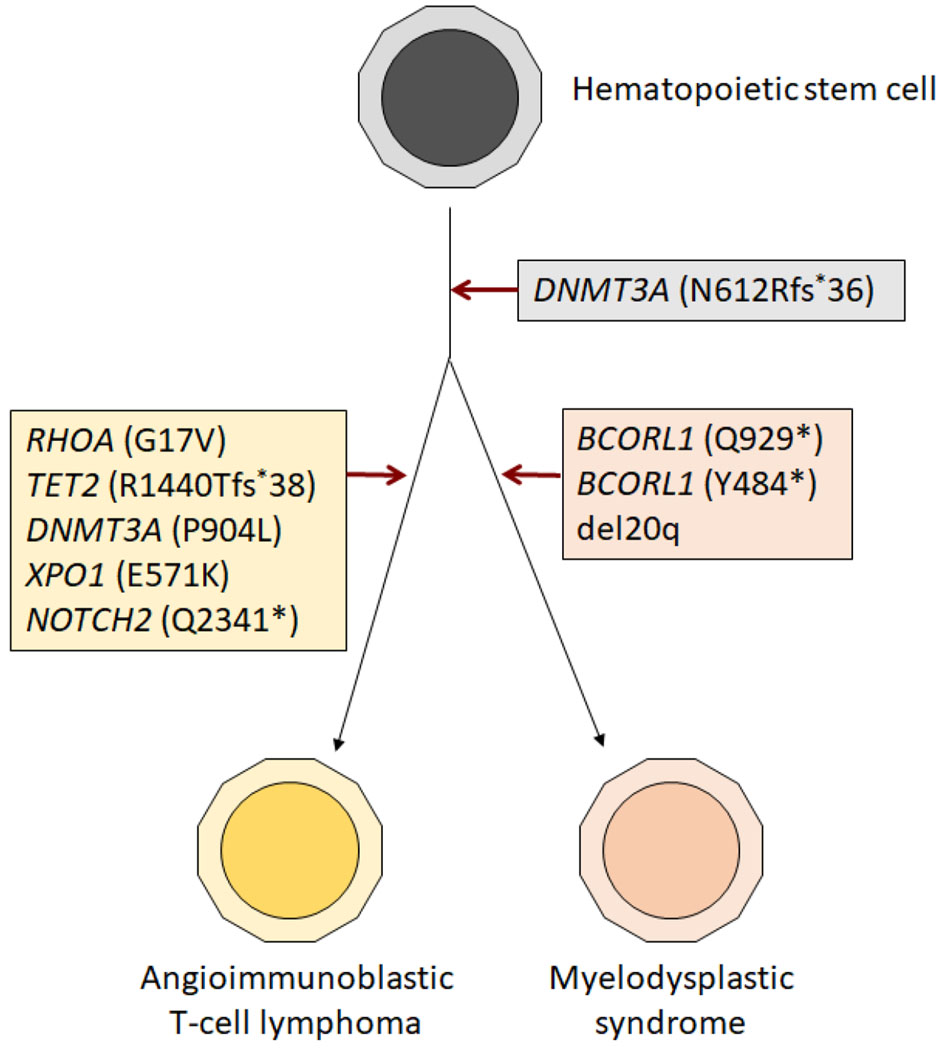
Figure 3. Schematic diagram showing steps in the development of AITL and MDS from the common hematopoietic progenitor precursor. The observation that the two sorted populations shared the DNMT3A p.N612Rfs*26 mutation, supporting that the AITL and MDS shared the common precursor. It underwent clonal divergence over time, leading to the development of two distinct neoplastic processes. AITL: angioimmunoblastic T-cell lymphoma; MDS: myelodysplastic syndrome.