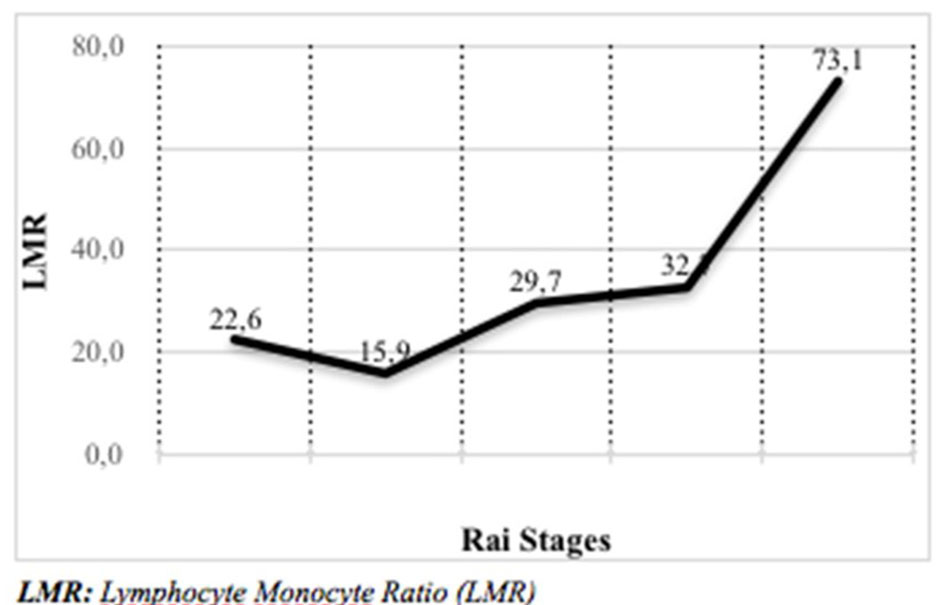
Figure 1. Relationship between LMR and Rai Stages. LMR: lymphocyte/monocyte ratio.
| Journal of Hematology, ISSN 1927-1212 print, 1927-1220 online, Open Access |
| Article copyright, the authors; Journal compilation copyright, J Hematol and Elmer Press Inc |
| Journal website https://www.thejh.org |
Original Article
Volume 9, Number 4, December 2020, pages 116-122
Prognostic Role of Lymphocyte/Monocyte Ratio in Chronic Lymphocytic Leukemia
Figure
Tables
| Range | Median | Mean ± SD or % | ||
|---|---|---|---|---|
| Demographic data such as age and gender, basal leukocyte, absolute lymphocyte and absolute monocyte counts; Rai and Binet Stages; cytogenetic examination (chromosome analysis and FISH analysis) results, follow-up period and treatment results were seen in Table 1. aCytogenetic results of all patients at initial diagnosis could not be reached. SD: standard deviation; FISH: fluorescence in situ hybridization; WBC: white blood cell; LMR: lymphocyte/monocyte ratio; ALC: absolute lymphocyte count; AMC: absolute monocyte count. | ||||
| Age | 35 - 85 | 66 | 65.5 ± 10.3 | |
| Gender | ||||
| Male | 109 | 63.0% | ||
| Female | 64 | 37.0% | ||
| WBC × 109/L | 3.93 - 315.0 | 27.6 | 46.4 ± 54.1 | |
| ALC × 109/L | 1.5 - 282.1 | 21.54 | 37.9 ± 49.0 | |
| AMC × 109/L | 0.01 - 19.0 | 0.79 | 1.5 ± 2.4 | |
| LMR | 0.66 - 2,464.5 | 26.7 | 121.5 ± 344.5 | |
| Rai Stage | ||||
| 0 | 44 | 25.4% | ||
| I | 52 | 30.1% | ||
| II | 32 | 18.5% | ||
| III | 28 | 16.2% | ||
| IV | 17 | 9.8% | ||
| Binet Stage | ||||
| A | 100 | 57.8% | ||
| B | 53 | 30.6% | ||
| C | 20 | 11.6% | ||
| Cytogenetic analysisa | ||||
| (+) | 123 | 71.1% | ||
| (-) | 50 | 28.9% | ||
| Del13q14 | ||||
| (-) | 68 | 64.8% | ||
| (+) | 37 | 35.2% | ||
| Del11q | ||||
| (-) | 90 | 88.2% | ||
| (+) | 12 | 11.8% | ||
| Del17p | ||||
| (-) | 108 | 90.8% | ||
| (+) | 11 | 9.2% | ||
| Trisomy 12 | ||||
| (-) | 78 | 80.4% | ||
| (+) | 19 | 19.6% | ||
| Follow-up period (month) | 0.03 - 166.2 | 35.50 | 39.12 ± 30.9 | |
| Treatment | ||||
| (-) | 100 | 57.8% | ||
| (+) | 73 | 42.2% | ||
| Response to first-line treatment | ||||
| (-) | 21 | 28.8% | ||
| (+) | 52 | 71.2% | ||
| Lines of treatment | ||||
| 1 or 2 | 56 | 76.7% | ||
| ≥ 3 | 17 | 23.3% | ||
| Progression | ||||
| (-) | 129 | 74.6% | ||
| (+) | 44 | 25.4% | ||
| Last situation | ||||
| Alive | 146 | 84.4% | ||
| Death | 27 | 15.6% | ||
| Age | WBC | Lymphocyte | Monocyte | Rai Stage | |
|---|---|---|---|---|---|
| As a result of correlation analysis (Spearman correlation), no significant correlation was observed between LMR and age, whereas a significant positive correlation was observed between leukocyte and lymphocyte counts. A significant negative correlation was observed between the LMR and the number of monocytes. A significant correlation was also observed between LMR and Rai Stages. WBC: white blood cell; LMR: lymphocyte/monocyte ratio. | |||||
| LMR, R | 0.030 | 0.474 | 0.525 | -0.438 | 0.312 |
| LMR, P | 0.694 | 0.000 | 0.000 | 0.000 | 0.000 |
| LMR | P | |||
|---|---|---|---|---|
| Min - max | Median | Mean ± SD | ||
| aWhen the relationship between LMR and Rai Stages was examined, it was seen that LMR increased significantly as the Rai Stage increased; bWhen the relationship between LMR and Binet Stages is examined, the median LMR was 24.4 in stage A, 31 in stage B and 41.1 in stage C; in Binet Stage C, LMR was seen to be significantly higher than that in stage A (P < 0.05); in Binet Stage B, LMR was not significantly different from stages A and C; cKruskal-Wallis (Mann-Whitney U test). LMR: lymphocyte/monocyte ratio; SD: standard deviation. | ||||
| Raia | ||||
| 0 | 4.9 - 950.0 | 22.6 | 48.3 ± 141.3 | 0.000c |
| I | 0.7 - 734.0 | 15.9 | 63.3 ± 125.3 | |
| II | 1.4 - 567.9 | 29.7 | 62.2 ± 101.6 | |
| III | 5.4 - 2,464.5 | 32.7 | 325.8 ± 707.3 | |
| IV | 10.9 - 1,519.3 | 73.1 | 264.3 ± 424.2 | |
| A | 0.7 - 950.0 | 24.4 | 57.7 ± 130.0 | |
| Binetb | ||||
| B | 1.4 - 2,326.0 | 31.0 | 161.4 ± 404.4 | |
| C | 10.9 - 2,464.5 | 41.1 | 334.7 ± 681.7 | 0.008 |
| LMR | P | |||
|---|---|---|---|---|
| Min - max | Median | Mean ± SD | ||
| During follow-up, at any time, the group with disease progression had a significantly higher LMR value than the group without progression. In addition, the LMR value was significantly higher in patients who died than others. aMann-Whitney U test. LMR: lymphocyte/monocyte ratio; SD: standard deviation. | ||||
| Progression | ||||
| (-) | 0.7 - 2,464.5 | 24.6 | 102.1 ± 321.4 | 0.022a |
| (+) | 1.4 - 2,326.0 | 43.2 | 178.3 ± 403.3 | |
| Last situation | ||||
| Alive | 0.7 - 2,464.5 | 25.0 | 110.1 ± 320.8 | 0.049a |
| Death | 2.4 - 2,326.0 | 57.4 | 183.2 ± 454.1 | |
| PFS (month)a | 95% CI | P | |||||
|---|---|---|---|---|---|---|---|
| LMR ≤ 26 | 107.2 | 81.6 - 132.8 | |||||
| LMR > 26 | 80.6 | 64.2 - 97.0 | 0.110 | ||||
| Total | 96.5 | 78.8 - 114.1 | |||||
| OS (month)b | 95% CI | P | |||||
| Kaplan-Meier (log-rank) method was used in survival analysis. aPFS was 107.2 months in patient group with LMR ≤ 26 (95% CI: 81.6 - 132.8, P > 0.05) and 80.6 months in patient group with LMR > 26 (95% CI: 64.2 - 97, P > 0.05). No statistically significant relationship was detected. The median PFS value of our study was calculated as 96.5 months in total. bOS was 131.8 months in patient group with LMR ≤ 26 (95% CI: 110.9 - 152.7, P > 0.05) and 98.1 months in patient group with LMR > 26 (95% CI: 81 - 115.2, P > 0.05). No statistically significant relationship was found. In our study, the OS was calculated as 120.6 months in all patients. PFS: progression-free survival; OS: overall survival; LMR: lymphocyte/monocyte ratio; CI: confidence interval. | |||||||
| LMR ≤ 26 | 131.8 | 110.9 - 152.7 | |||||
| LMR > 26 | 98.1 | 81.0 - 115.2 | 0.111 | ||||
| Total | 120.6 | 104.6 - 136.5 | |||||