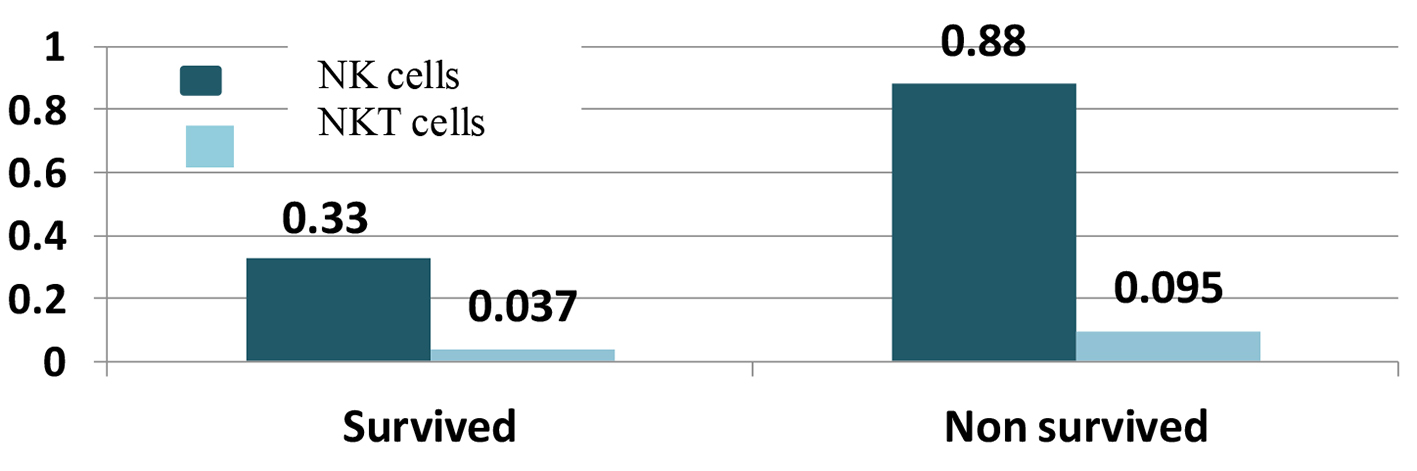
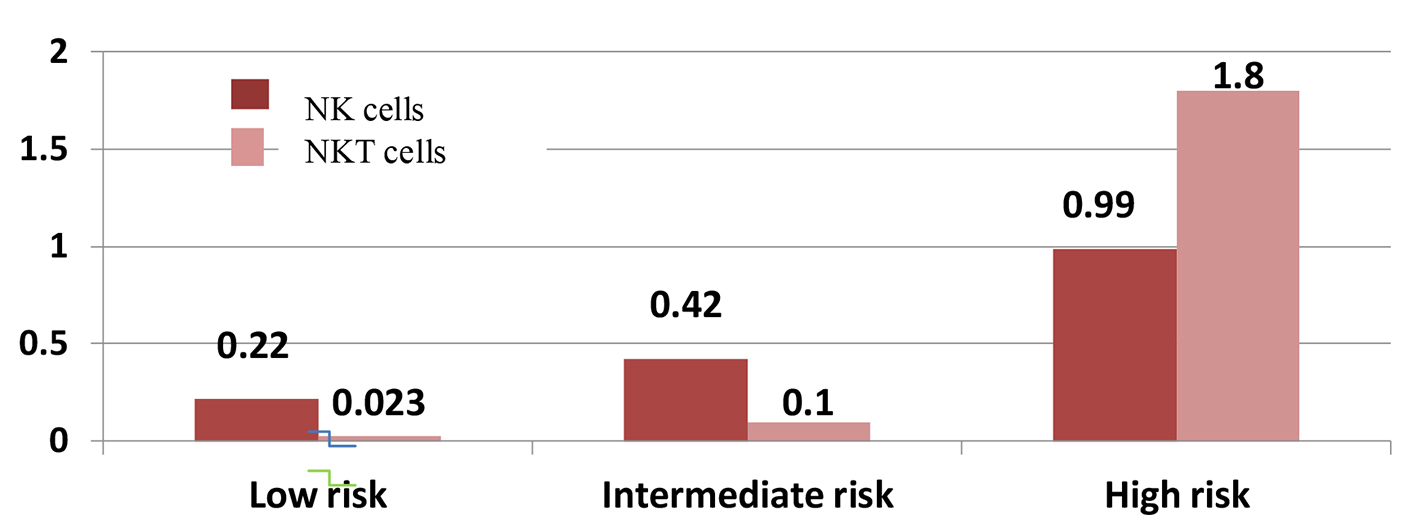
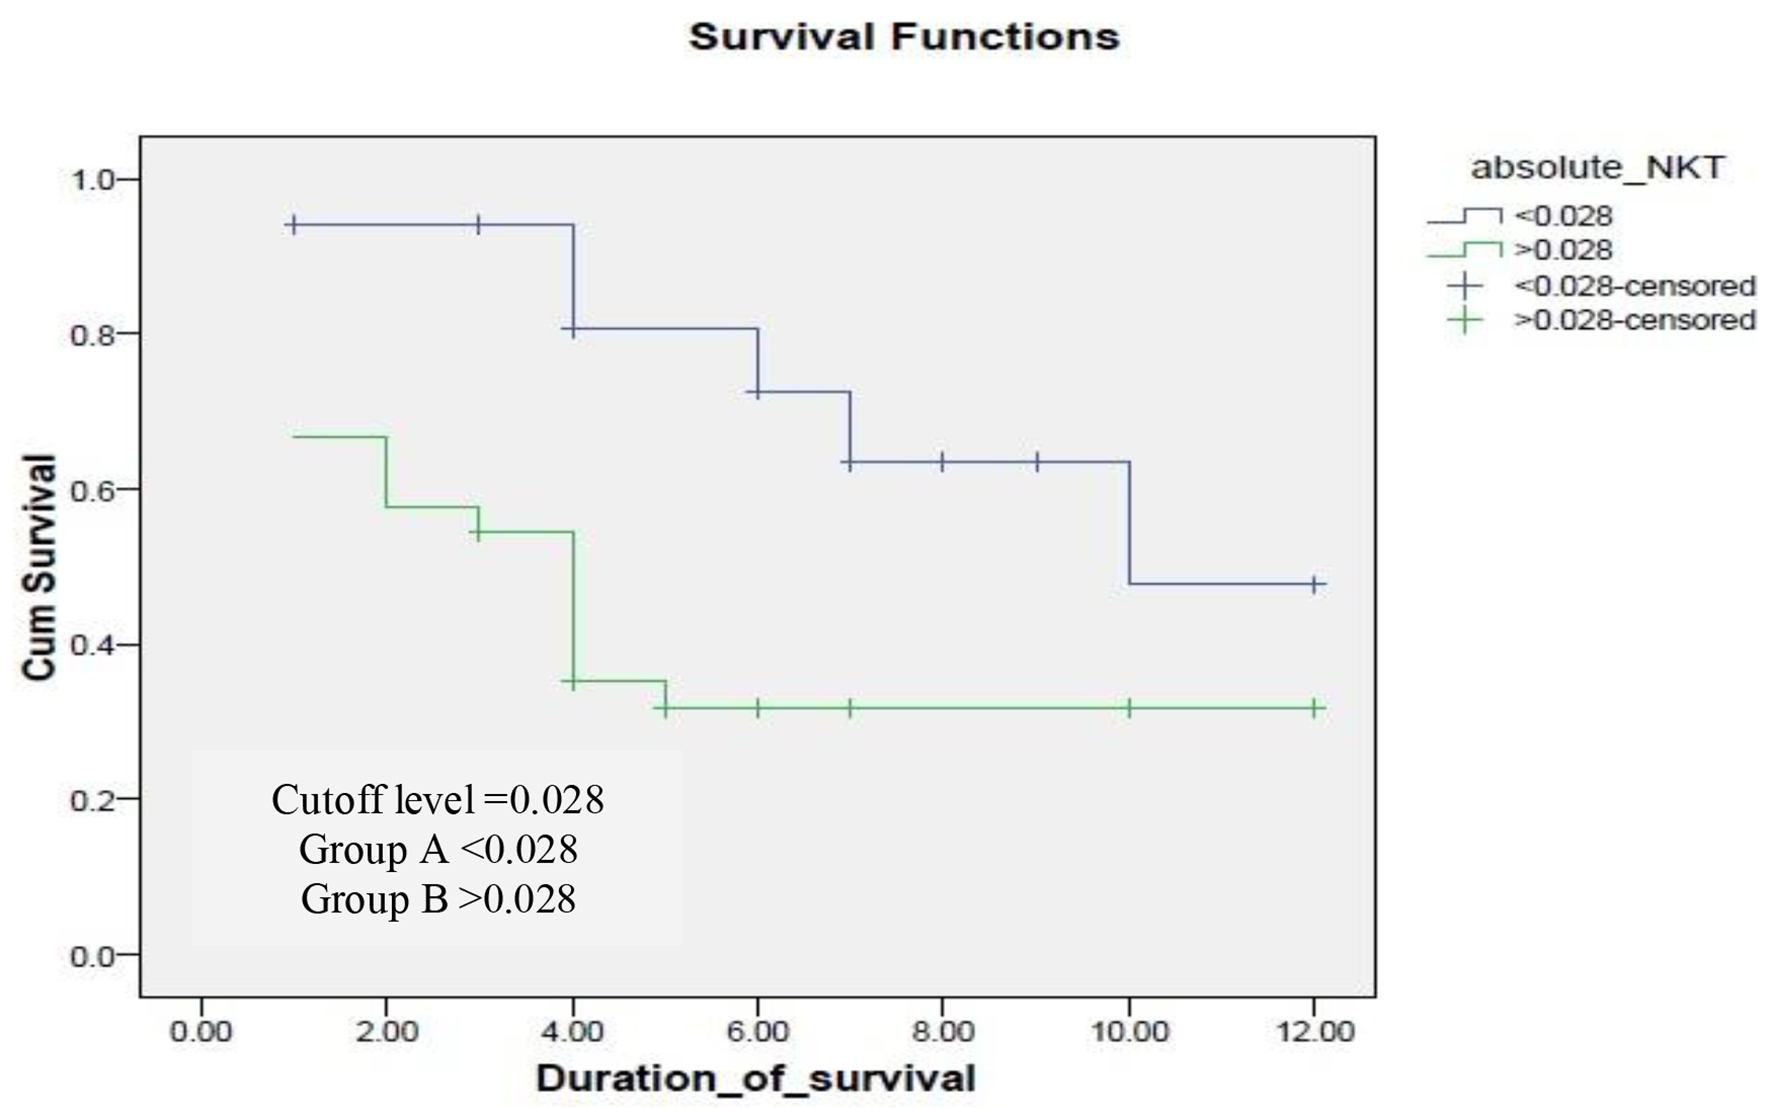
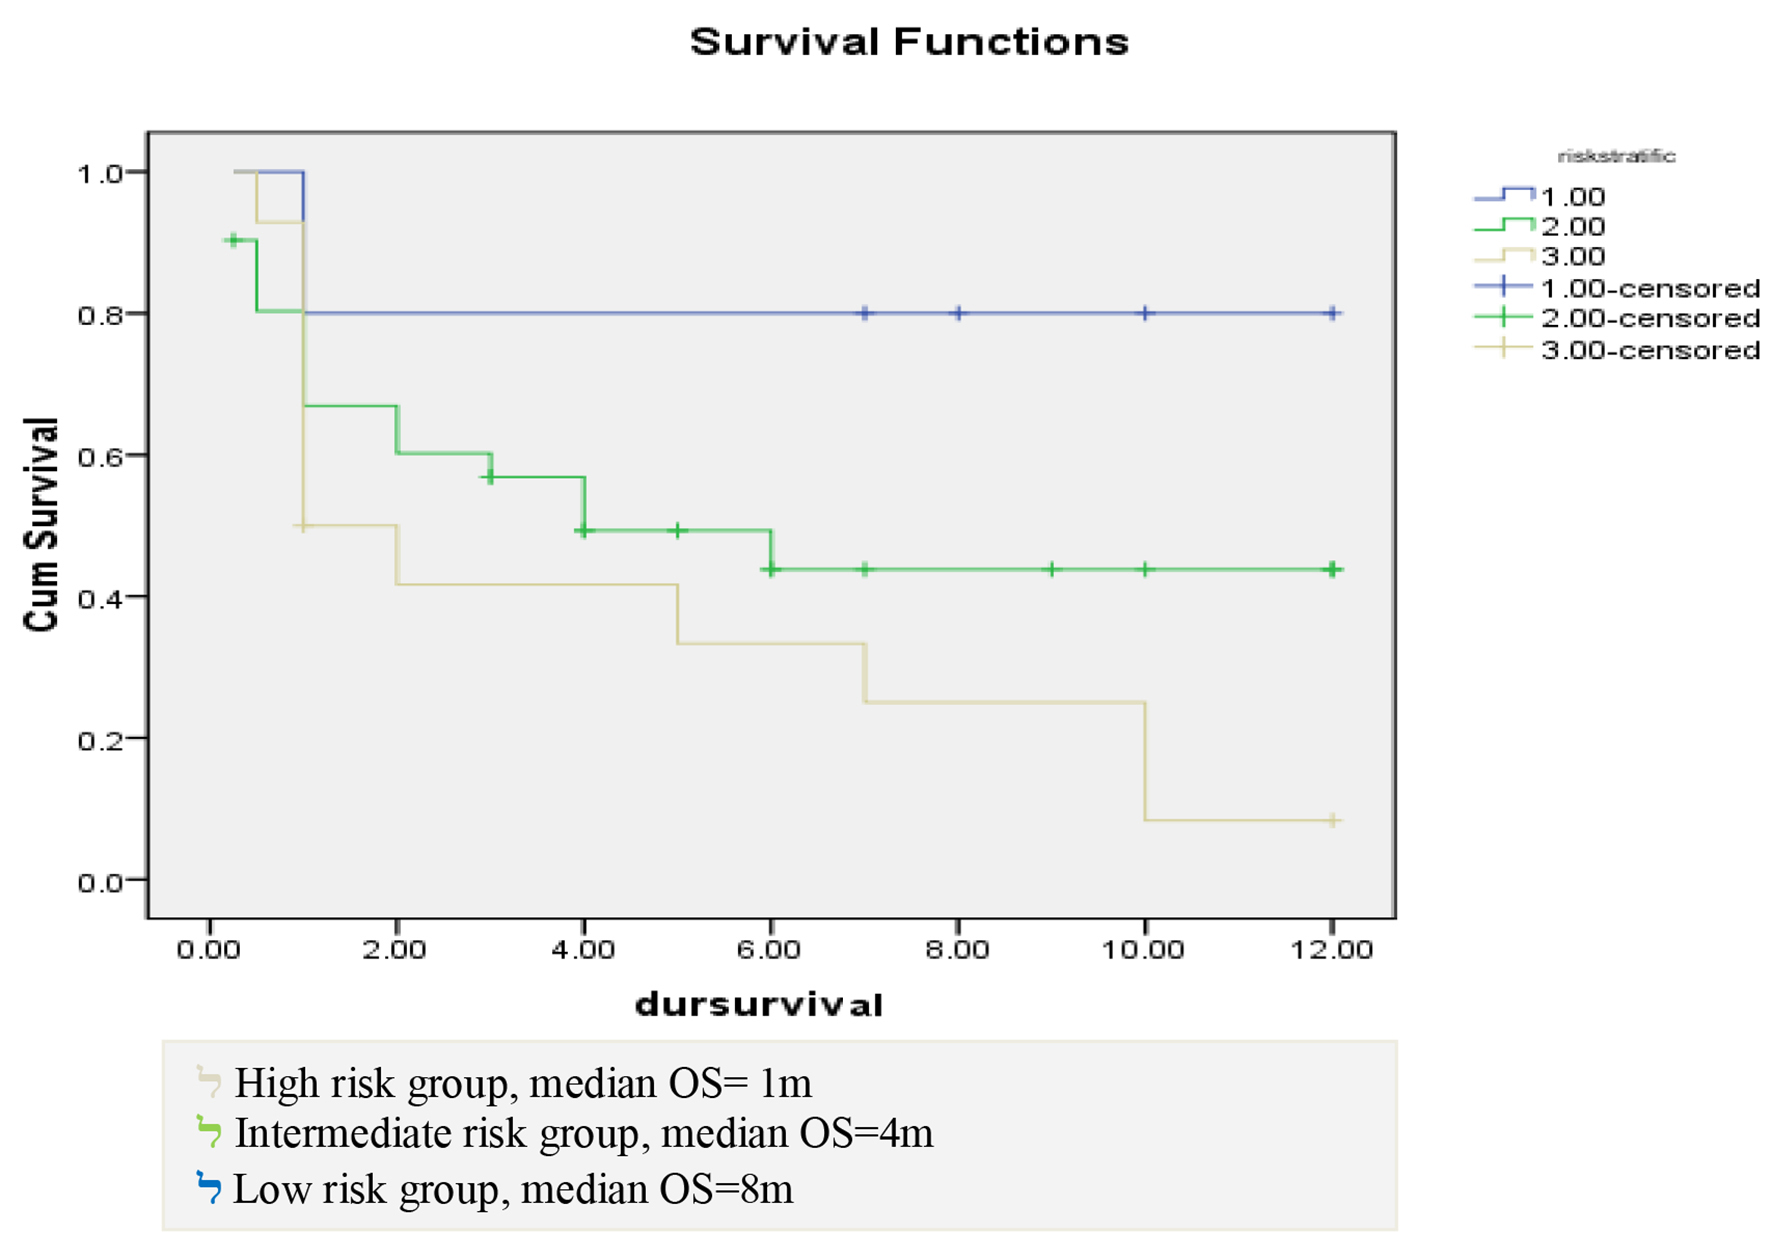
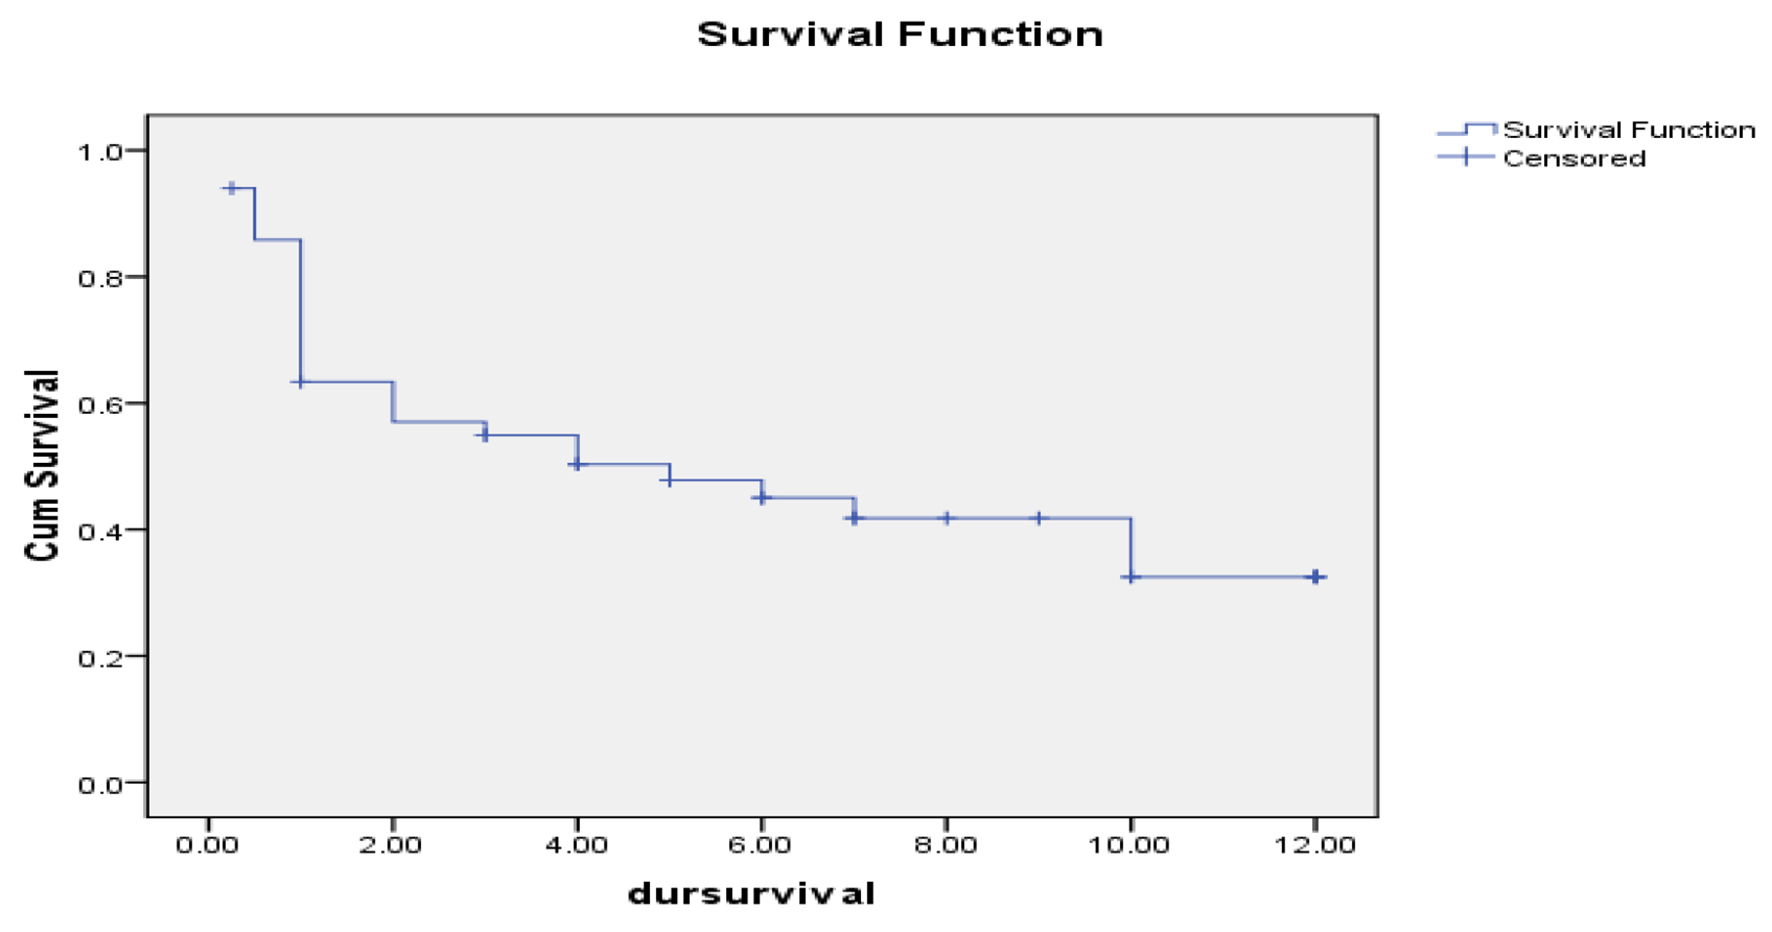
Figure 1. Natural killer (NK) and natural killer-like T (NKT) cells with survival.
| Journal of Hematology, ISSN 1927-1212 print, 1927-1220 online, Open Access |
| Article copyright, the authors; Journal compilation copyright, J Hematol and Elmer Press Inc |
| Journal website https://www.thejh.org |
Original Article
Volume 9, Number 3, September 2020, pages 62-70
Clinical Impact of Percentage of Natural Killer Cells and Natural Killer-Like T Cell Population in Acute Myeloid Leukemia
Figures
Tables
| Demographic data | Cases (N = 50) |
|---|---|
| AML: acute myeloid leukemia. | |
| Age | |
| Mean | 44.7 |
| Standard deviation | 15.36 |
| Gender | |
| Male, n (%) | 25 (50) |
| Female, n (%) | 25 (50) |
| Parameters | Number of cases (N = 50) | |
|---|---|---|
| N | % | |
| AML: acute myeloid leukemia; FISH: fluorescent in situ hybridization. | ||
| WHO classification of AML cases | ||
| AML with recurrent cytogenetics | ||
| AML with t(8;21) | 4 | 8.0 |
| AML with inv16 | 3 | 6.0 |
| Acute promyelocytic leukemia with PML/RARA | 7 | 14.0 |
| AML with t(6;9) | 1 | 2.0 |
| AML with bi-allelic mutation of CEPBA | 1 | 2.0 |
| AML without maturation | 7 | 14.0 |
| AML with maturation | 12 | 24.0 |
| Acute myelomonocytic leukemia | 10 | 20.0 |
| Acute monoblastic/monocytic leukemia | 3 | 6.0 |
| Pure erythroid leukemia | 2 | 4.0 |
| Conventional karyotyping | ||
| Normal | 43 | 86.0 |
| 47,xy,+8 | 4 | 8.0 |
| 47,xy,+9 | 1 | 2.0 |
| 46,xy,-9 | 1 | 2.0 |
| 46,xy,t(6:9) | 1 | 2.0 |
| Cancer cytogenetics (FISH) | 34 | |
| Positive | ||
| inv16 | 3 | 6.0 |
| t(15;17) | 7 | 14.0 |
| t(8;21) | 4 | 8.0 |
| Negative | 20 | 40 |
| Not available | 16 | 32 |
| Response to induction treatment | Number of patients (N = 44) | |
|---|---|---|
| N | % | |
| AML: acute myeloid leukemia; CR: complete remission; PR: partial response. | ||
| CR | 17 | 34.0 |
| PR | 8 | 26.0 |
| Refractory | 5 | 10.0 |
| Died in aplasia | 14 | 28.0 |
| Response to induction | NK cells | NKT cells | ||
|---|---|---|---|---|
| Median | Range | Median | Range | |
| NK: natural killer; NKT: natural killer-like T; CR: complete remission; PR: partial response. | ||||
| CR | 0.4350 | 0.00 - 1.90 | 0.026 | 0.01 - 0.390 |
| PR | 0.5325 | 0.00 - 1.02 | 0.095 | 0.004 - 0.270 |
| Refractory | 0.88 | 0.00 - 2.56 | 0.050 | 0.020 - 0.210 |
| Died after induction | 0.77 | 0.08 - 3.70 | 0.090 | 0.00 - 2.01 |
| Response to induction groups | NK cells | NKT cells |
|---|---|---|
| NK: natural killer; NKT: natural killer-like T; CR: complete remission; PR: partial response. | ||
| CR vs. PR | 0.862 | 0.63 |
| CR vs. refractory cases | 0.29 | 0.33 |
| CR vs. died after induction | 0.43 | 0.56 |
| Risk groups | NK cells | NKT cells |
|---|---|---|
| NK: natural killer; NKT: natural killer-like T. | ||
| Low vs. intermediate risk | 0.29 | 0.39 |
| Low vs. high risk | 0.009 | 0.05 |
| Intermediate vs. high risk | 0.06 | 0.12 |