Figures
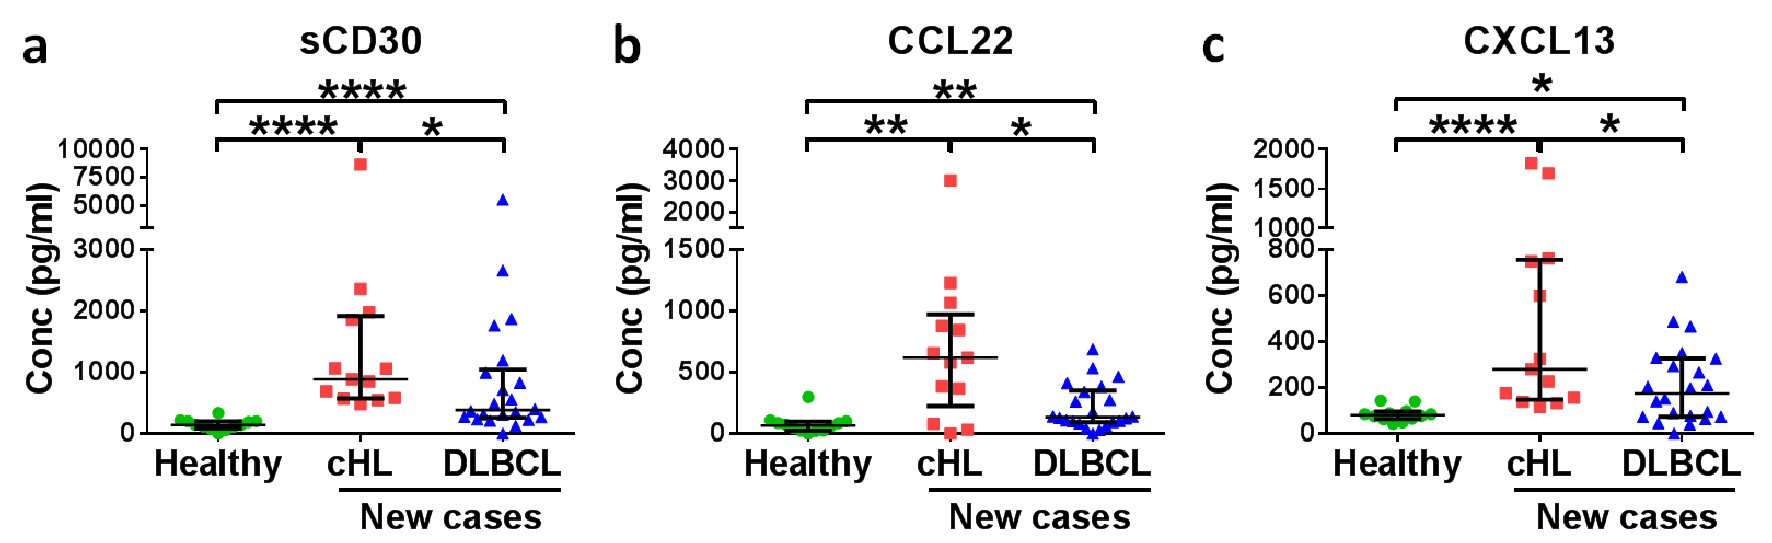
Figure 1. Soluble CD30 (sCD30) and CCL22 have diagnostic potential for HL patients. Medians with interquartile ranges of (a) sCD30, (b) CCL22 and (c) CXCL13 plasma levels in healthy donors, new cases of HL patients and DLBCL patients are shown. *P < 0.05, **P < 0.01, ****P < 0.0001 (Mann-Whitney U test).
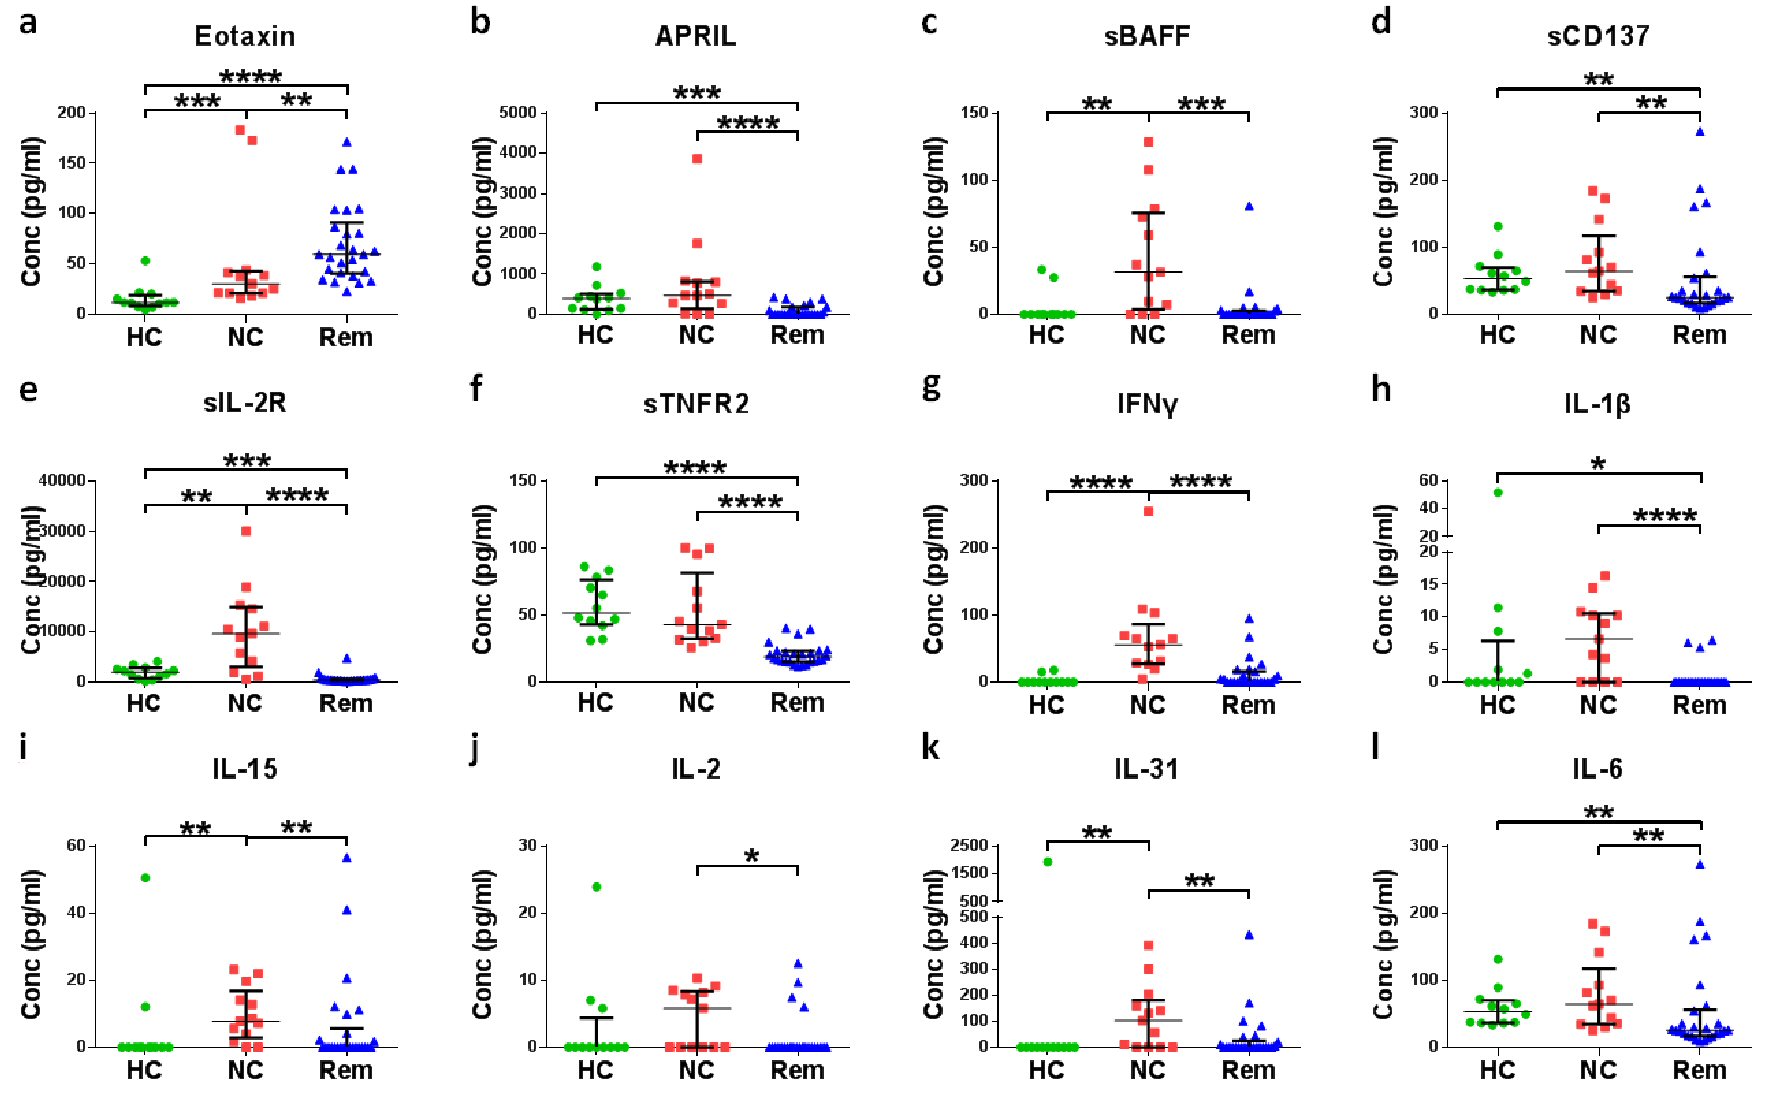
Figure 2. Screening of soluble factors for the confirmation of remission status of cHL. Plasma of different cHL patients at diagnosis (new cases (NC)) were compared with plasma of healthy controls (HC) and plasma of cHL patients in remission (Rem). *P < 0.05, **P < 0.01, ***P < 0.001, ****P < 0.0001 (Mann-Whitney test).
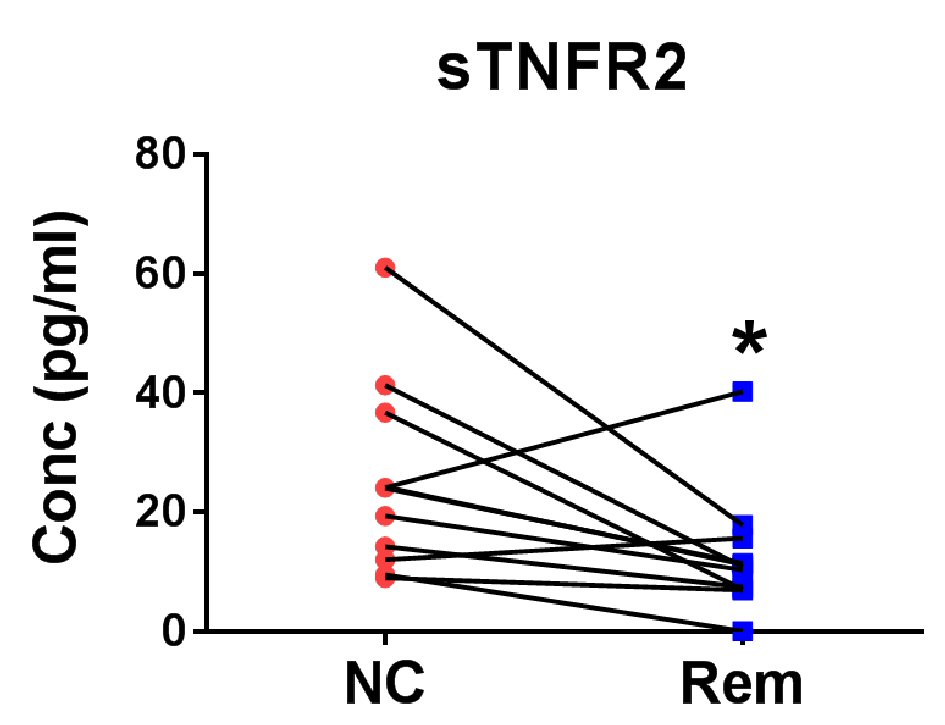
Figure 3. Verification of soluble factors for the confirmation of remission status of cHL. Eight pairs of cHL patient plasma before treatment (new case (NC)) and after remission (Rem) were measured for TNFR2 level. *P < 0.05 (two-tailed, Wilcoxon matched-pairs signed rank test).
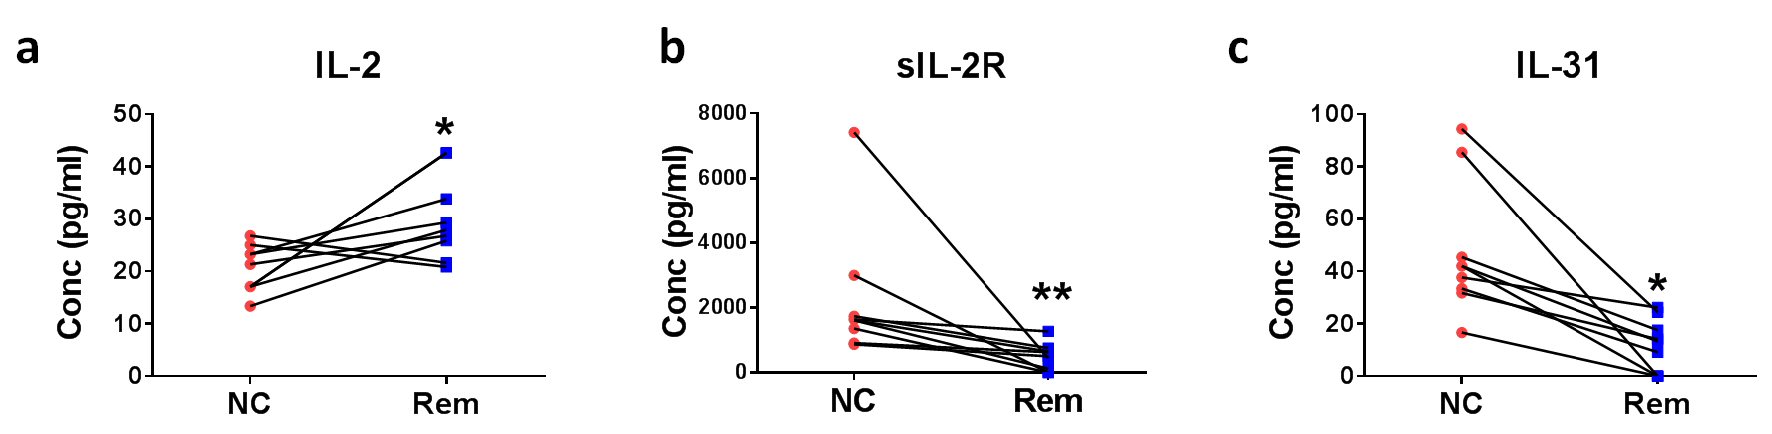
Figure 4. Soluble factors for the confirmation of remission status of DLBCL. Eight pairs of DLBCL patient plasmas before treatment (new cases (NC)) and after remission (Rem) were analyzed for (a) IL-2, (b) sIL-2R, and (c) IL-31 concentrations. *P < 0.05, **P < 0.01 (two-tailed, Wilcoxon matched-pairs signed rank test).
Tables
Table 1. Statistics of the Patients
| Cases | Age/median (interquartile range) |
|---|
| At initial diagnosis (remission %)a | During treatment or relapse | In remission | Total (remission %)a | At initial diagnosis | Total |
|---|
| aNumbers in parenthesis indicate the percentage of patients who eventually achieved remission. bSeven cases are from patients already included in the screening test for initial diagnosis. |
| Screening test | | | | | | |
| cHL | 13 (61.5%) | 14 | 26 | 49 (73.5%) | 27 (22.25, 33.25) | 28 (23, 38.5) |
| DLBCL | 22 (59.1%) | 0 | - | 22 (59.1%) | 61 (50.75, 72.75) | 61 (50.75, 72.75) |
| Healthy controls | - | - | - | 12 | | 27 (25, 29.75) |
| Verification test | | | | | | |
| cHL | 8b | | 8 | 8 | - | - |
| DLBCL | 8 | | 8 | 8 | - | - |
Table 2. Soluble Factors That Occur at Concentrations Significantly Different Between the Plasma of Initially Diagnosed cHL Patients and Healthy Controls
| Healthy control | HL initial diagnosis | DLBCL initial diagnosis | P (cHL vs. healthy) | P (cHL vs. DLBCL) |
|---|
| Listed are the median values of respective concentrations (pg/mL). aThe three soluble factors that are both significantly different in cHL vs. healthy control, and in cHL vs. DLBCL. P values were calculated using Mann-Whitney U test. ND: not detectable. |
| sCD137L | 8.59 | 55.70 | 46.09 | 0.00591 | 0.724 |
| sCD137 | 53.06 | 64.38 | 159.30 | 0.54963 | 0.009 |
| sBAFF | ND | 31.58 | 4.55 | 0.00278 | 0.159 |
| CXCL13a | 81.19 | 279.84 | 152.41 | 0.00009 | 0.041 |
| sCD30a | 141.79 | 885.04 | 369.44 | 0.00002 | 0.015 |
| ENA78 | ND | 142.28 | 270.10 | 0.00005 | 0.555 |
| Eotaxin | 11.80 | 30.33 | 25.13 | 0.00110 | 0.428 |
| Eotaxin-2 | 43.39 | 94.38 | 63.22 | 0.03164 | 0.169 |
| FGF-2 | ND | 11.47 | ND | 0.00828 | 0.408 |
| HGF | 11.85 | 110.24 | 140.76 | 0.00007 | 0.302 |
| IFN-γ | ND | 55.79 | 54.08 | 0.00002 | 0.88 |
| IL-15 | ND | 7.79 | 4.81 | 0.00673 | 0.319 |
| IL-16 | 562.79 | 262.40 | 463.37 | 0.01233 | 0.041 |
| IL-18 | ND | 77.19 | 102.40 | 0.00019 | 0.933 |
| IL-2R | 1,982.09 | 9,679.94 | 10,279.12 | 0.00331 | 0.533 |
| IL-20 | ND | 4.60 | 0.57 | 0.01427 | 0.062 |
| IL-23 | ND | 22.07 | ND | 0.03562 | 0.408 |
| IL-3 | ND | 33.25 | 15.01 | 0.00126 | 0.302 |
| IL-31 | ND | 102.72 | 41.64 | 0.00828 | 0.489 |
| IL-4 | ND | 26.52 | 3.93 | 0.01406 | 0.287 |
| IL-7 | ND | 1.04 | 1.17 | 0.00039 | 0.88 |
| IL-8 | ND | 1.01 | ND | 0.03557 | 0.625 |
| IL-9 | ND | 4.69 | 0.96 | 0.01762 | 0.987 |
| IP-10 | 5.10 | 47.39 | 39.94 | 0.00007 | 0.428 |
| CCL8 | 1.05 | 10.24 | 9.15 | 0.00009 | 0.353 |
| CCL22a | 67.01 | 619.59 | 128.30 | 0.00361 | 0.013 |
| MIP-1 α | ND | 7.05 | 3.27 | 0.02283 | 0.169 |
| MIP-3 α | ND | 17.44 | 17.44 | 0.00828 | 0.462 |
| SDF-1 α | 465.55 | ND | ND | 0.00026 | 0.801 |
| TSLP | ND | 17.03 | 12.61 | 0.00451 | 0.169 |
| VEGF-A | ND | 35.21 | 15.07 | 0.00126 | 0.257 |