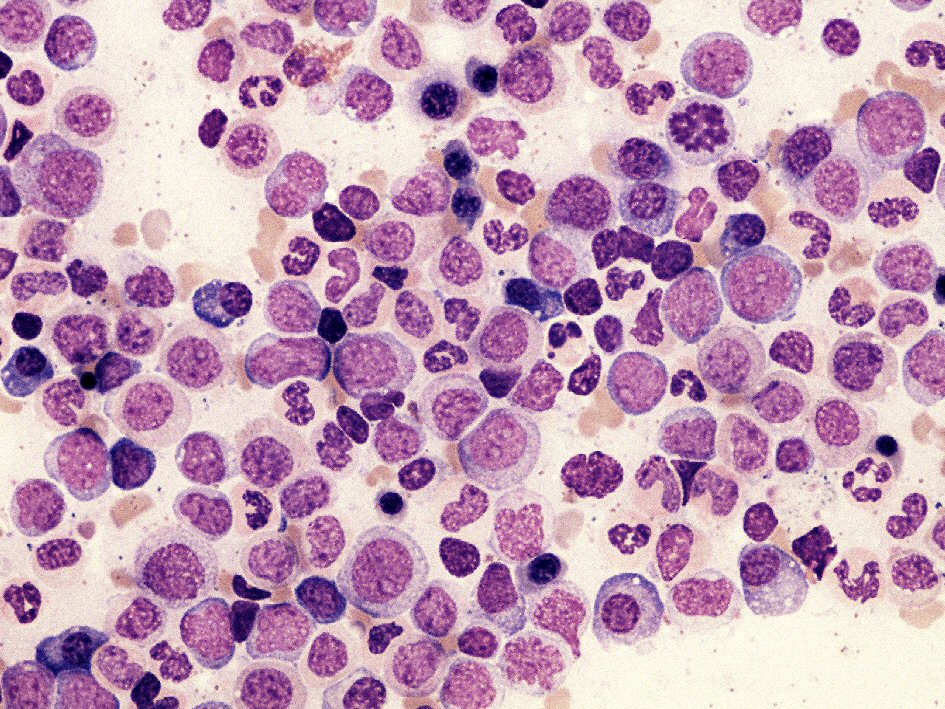
Figure 1. The bone marrow aspirate smear shows myeloid hyperplasia and immature monocytoid cells. No basophilia or pseudo-Gaucher cells are observed.
| Journal of Hematology, ISSN 1927-1212 print, 1927-1220 online, Open Access |
| Article copyright, the authors; Journal compilation copyright, J Hematol and Elmer Press Inc |
| Journal website http://www.thejh.org |
Case Report
Volume 7, Number 3, September 2018, pages 120-123
Chronic Myeloid Leukemia With P190 BCR-ABL Translocation and Persistent Moderate Monocytosis: A Case Report
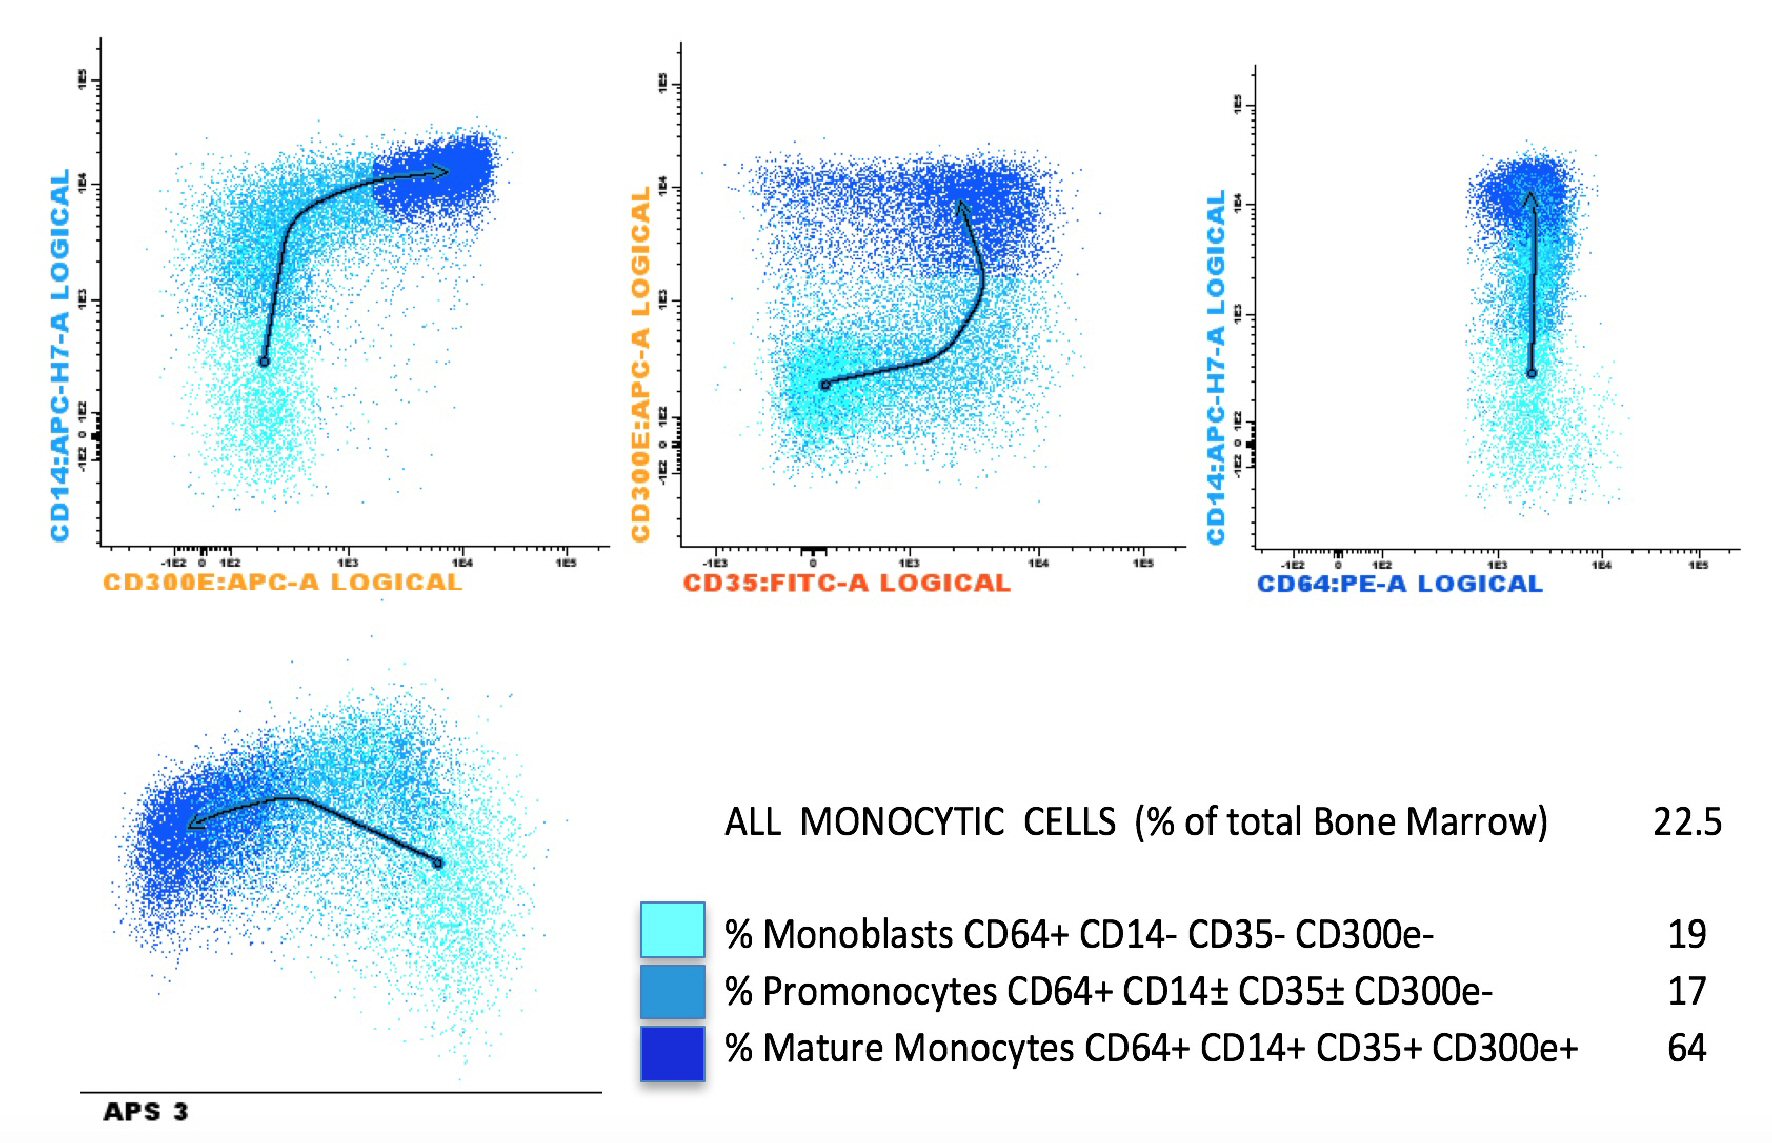
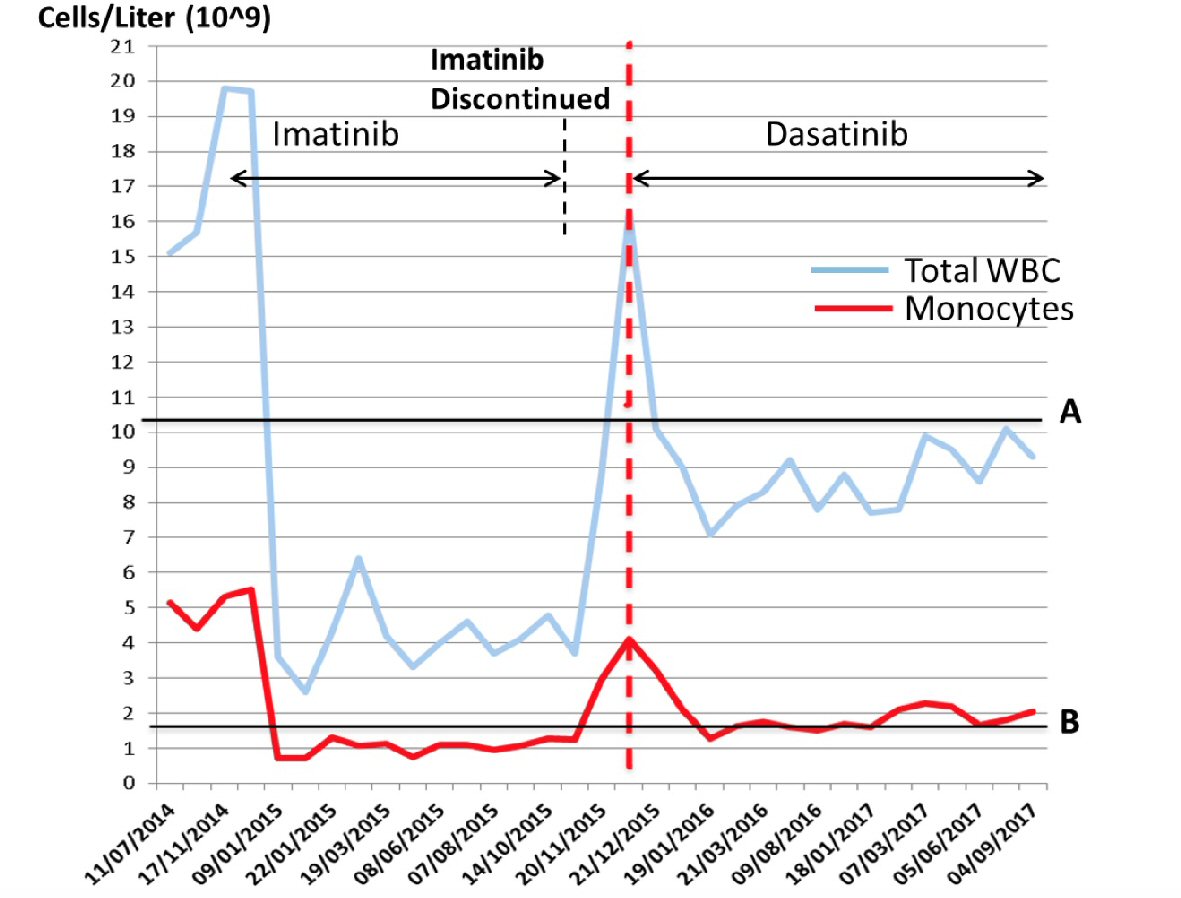
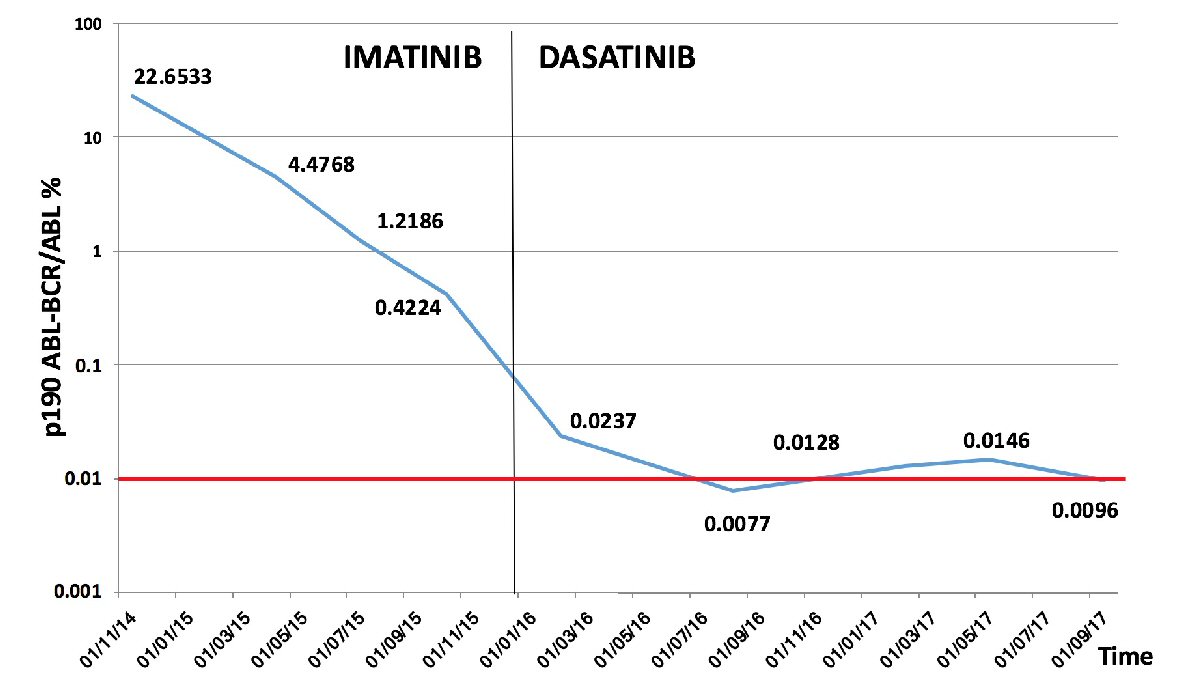
Figures