Journal of Hematology, ISSN 1927-1212 print, 1927-1220 online, Open Access
Article copyright, the authors; Journal compilation copyright, J Hematol and Elmer Press Inc
Journal website http://www.thejh.org

Original Article

Volume 7, Number 3, September 2018, pages 87-95


Efficacy and Safety of IQYMUNE®, a Ten Percent Intravenous Immunoglobulin in Adult Patients With Chronic, Primary Immune Thrombocytopenia

Figure

Figure 1.
Figure 1. Platelet count over time. Blood samples for platelet determination were drawn on Day 1 pre-infusion (hospital), Day 2 post-infusion (hospital), Days 3, 4, 5, 6, 7, 9, 11 (outpatient/visiting nurse), Day 14 ± 1 (hospital), Day 21 ± 1 (outpatient/visiting nurse) and Day 30 ± 1 (hospital). Means and standard deviations are presented. EOS/ET: end of study/early termination.

Tables

Table 1. Demographics and Baseline Characteristics of Patients (N = 38 Patients)
 
ParameterResults
*Defined as a drop in platelet count to ≤ 50 × 109. ITP: immune thrombocytopenia.
Demographics
  Sex (n (%))
    Male14 (36.8)
    Female24 (63.2%)
  Age (years)
    Mean ± SD37.2 ± 11.8
    Median (range)35.0 (18, 60)
  Weight (kg)
    Mean ± SD67.5 ± 17.0
    Median (range)68.5 (43.0, 115.0)
  Body mass index (kg/m2)
    Mean ± SD23.8 ± 4.2
    Median (range)23.8 (17.0, 34.9)
Medical condition/history reported by ≥ 3 patients (n (%))
  Hypertension6 (15.8)
  Anemia6 (15.8)
  Tonsillectomy5 (13.2)
  Gastritis5 (13.2)
  Appendectomy4 (10.5)
History of ITP
  Time from diagnosis (years)
    Mean ± SD7.55 ± 8.63
    Median (range)3.65 (1.0, 40.7)
  Platelet count at diagnosis (109/L)
    Mean ± SD24.4 ± 24.7
    Median (range)17.0 (0.7, 101.0)
  Frequency of acute* episodes per month (n)
    Mean ± SD0.74 ± 2.03
    Median (range)0.30 (0.0, 12.0)
  Time from previous acute* episode (months)
    Mean ± SD16.67 ± 36.36
    Median (range)3.00 (0.0, 157.0)
  Platelet count at baseline (109/L)
    Mean ± SD16.7 ± 8.00
    Median (range)18.1 (1, 29)
  Patients with a platelet count ≤ 20 × 109/L at baseline (n (%))23 (60.5)
  Refractory ITP and splenectomy (n (%))6 (15.8)
Bleeding (n (%))
  Bleeding history30 (78.9)
  Life-threatening bleeding history3 (7.9)
  Bleeding history reported in ≥ 3 patients
     Cutaneous27 (71.1)
     Mucosal17 (56.7)
     Genitourinary tract7 (23.3)
  Bleeding at baseline29 (76.3)
Prior ITP medication in ≥ 3 patients (n (%))35 (92.1)
  Corticosteroids, systemic32 (84.2)
  Immunoglobulins11 (28.9)
  Azathioprine3 (7.9)
  Eltrombopag2 (5.3)
  Rituximab2 (5.3)
  Other blood products2 (5.3)


Table 2. Efficacy Endpoints (Full Analysis Set)
 
Efficacy variableN = 38
Response was defined as a platelet count ≥ 30 × 109/L and a 2-fold increase from baseline, no new bleeding events, and no intake of forbidden medications. Complete Response was defined as a platelet count ≥ 100 × 109/L, no new bleeding events, and no intake of forbidden medications. *Determined in the full analysis set N = 38. †N = 37; exclusion of one patient who took a forbidden treatment on Day 1. CI: confidence interval.
Response, n (%); (Clopper-Pearson 95% CI)24 (63.2); (46.0; 78.2)
  Time to Response (days), median (range)1 (1 - 6)
  Duration of Response (days), estimate (Kaplan Meier 95% CI)13.5 (10.0; 20.0)
  Loss of Response, n (%); (Clopper-Pearson 95% CI)17 (70.8); (48.9; 87.4)
  No Response, n (%); (Clopper-Pearson 95% CI)14 (36.8); (21.8; 54.0)
Complete Response, n (%); (Clopper-Pearson 95% CI)11 (28.9); (15.4; 45.9)
  Time to Complete Response (days), median (range)2 (1 - 8)
  Duration of Complete Response (days), estimate (Kaplan Meier 95% CI)12 (10.0; 18.0)
  Loss of Complete Response, n (%); (Clopper-Pearson 95% CI)9 (81.8); (48.2; 97.7)
  No Complete Response, n (%); (Clopper-Pearson 95% CI)27 (71.1); (54.1; 84.6)
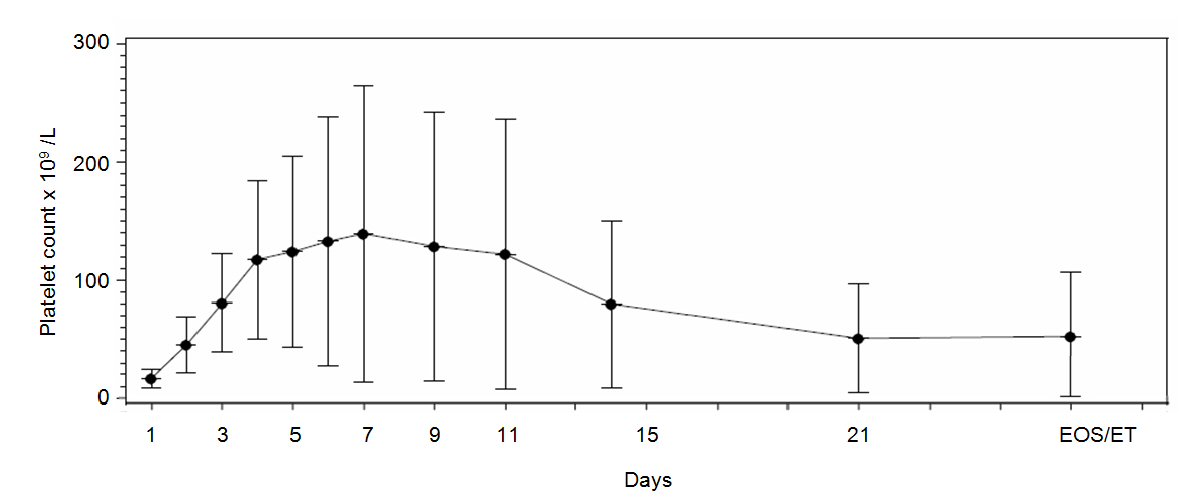
Maximum platelet count (× 109)*, mean (Hodges-Lehmann 95% CI)165 (113; 189)
  Time to maximum platelet count (days)†, median (Kaplan Meier 95% CI)4.0 (3.0; 6.0)


Table 3. Safety Evaluation: Adverse Events and Serious Adverse Events (38 Patients, 73 Infusions)
 
Patients (N (% patients))Adverse event (N)
GFR: glomerular filtration rate.
Treatment emergent adverse events, total31 (81.6)89
Treatment emergent drug-related adverse events, total25 (65.8)66
Treatment emergent drug-related adverse events, in ≥ two patients
  Headache13 (34.2)21
  Pyrexia6 (15.8)6
  Creatinine renal clearance decrease or GFR decrease4 (10.5)6
  Systolic blood pressure increase3 (7.9)4
  Vomiting3 (7.9)3
  Body temperature increase2 (5.3)2
  Influenza-like illness2 (5.3)2
  Nausea2 (5.3)2
  Arthralgia2 (5.3)2
Temporally associated adverse events, total27 (71.1)64
Discontinuation of study drug due to adverse event2 (5.3)4
Interruption of infusion due to adverse event2 (5.3)2
Flow rate decrease due to mild pyrexia1 (2.6)1
Serious adverse events, total7 (18.4)8
  Study drug overdose1 (2.6)1
  Study drug underdose1 (2.6)1
  Decrease in glomerular filtration rate1 (2.6)1
  Aseptic meningitis1 (2.6)1
  Influenza-like illness1 (2.6)1
  Pyrexia1 (2.6)1
  Headache, recurrent1 (2.6)1
  Positive human immunodeficiency virus test1 (2.6)1