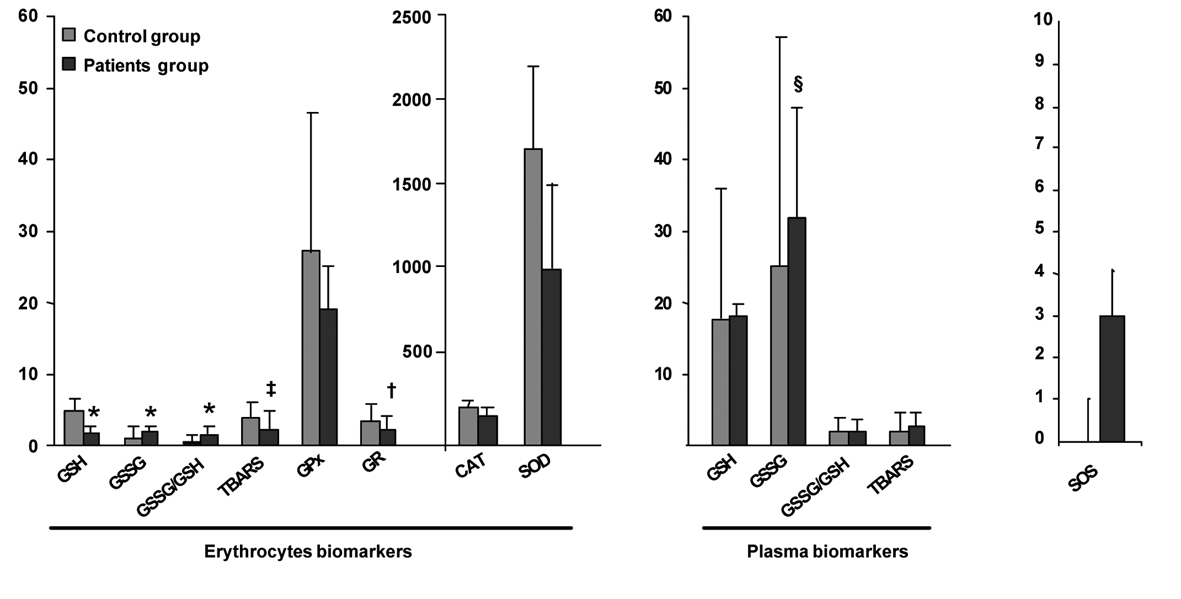
Figure 1. Comparison of OS biomarkers values of early stage CLL and healthy control groups. Results are presented as mean ± standard deviation (erythrocytes biomarkers GSH, GSSG, GSSG/GSH, CAT, GPx, SOD and plasma biomarkers GSSG, GSSG/GSH) or geometric mean ± antilog standard deviation (erythrocytes biomarkers TBARS, GR and plasma biomarkers GSH, TBARS) in the healthy control group (n = 37) and early stages of CLL patients group (n = 37). *Statistical differences between healthy control and early stages of CLL patients with a P value < 0.001, †with a P value = 0.001, ‡with a P value = 0.013, §with a P value = 0.016.
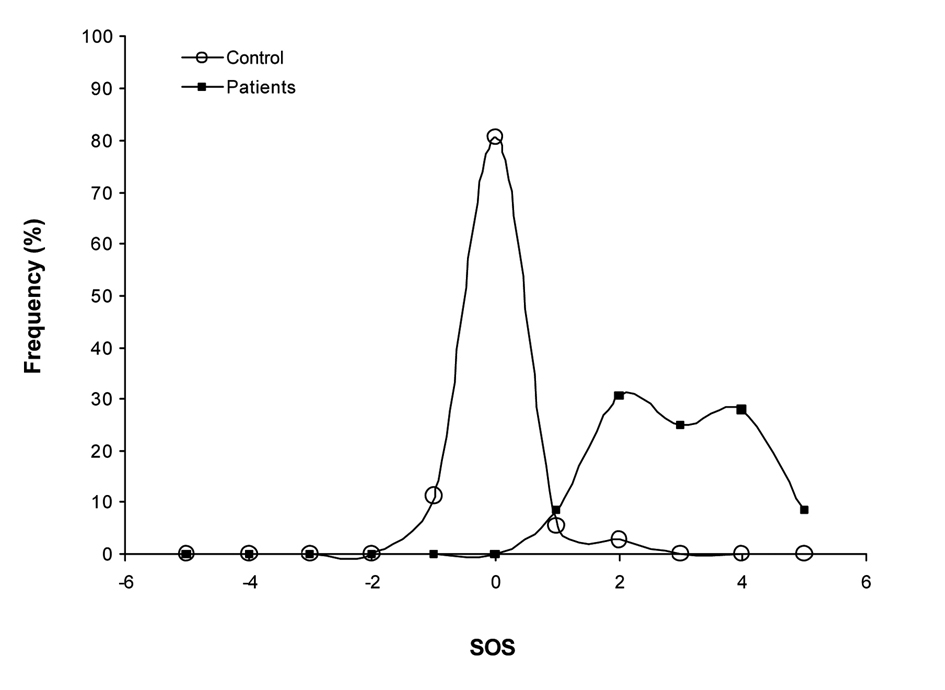
Figure 2. Frequency distribution of the SOS. Healthy control individuals present a normal distribution centered on zero. The frequency distribution of the SOS on early stage CLL did not follow a normal distribution, since the score was displaced towards positive values.
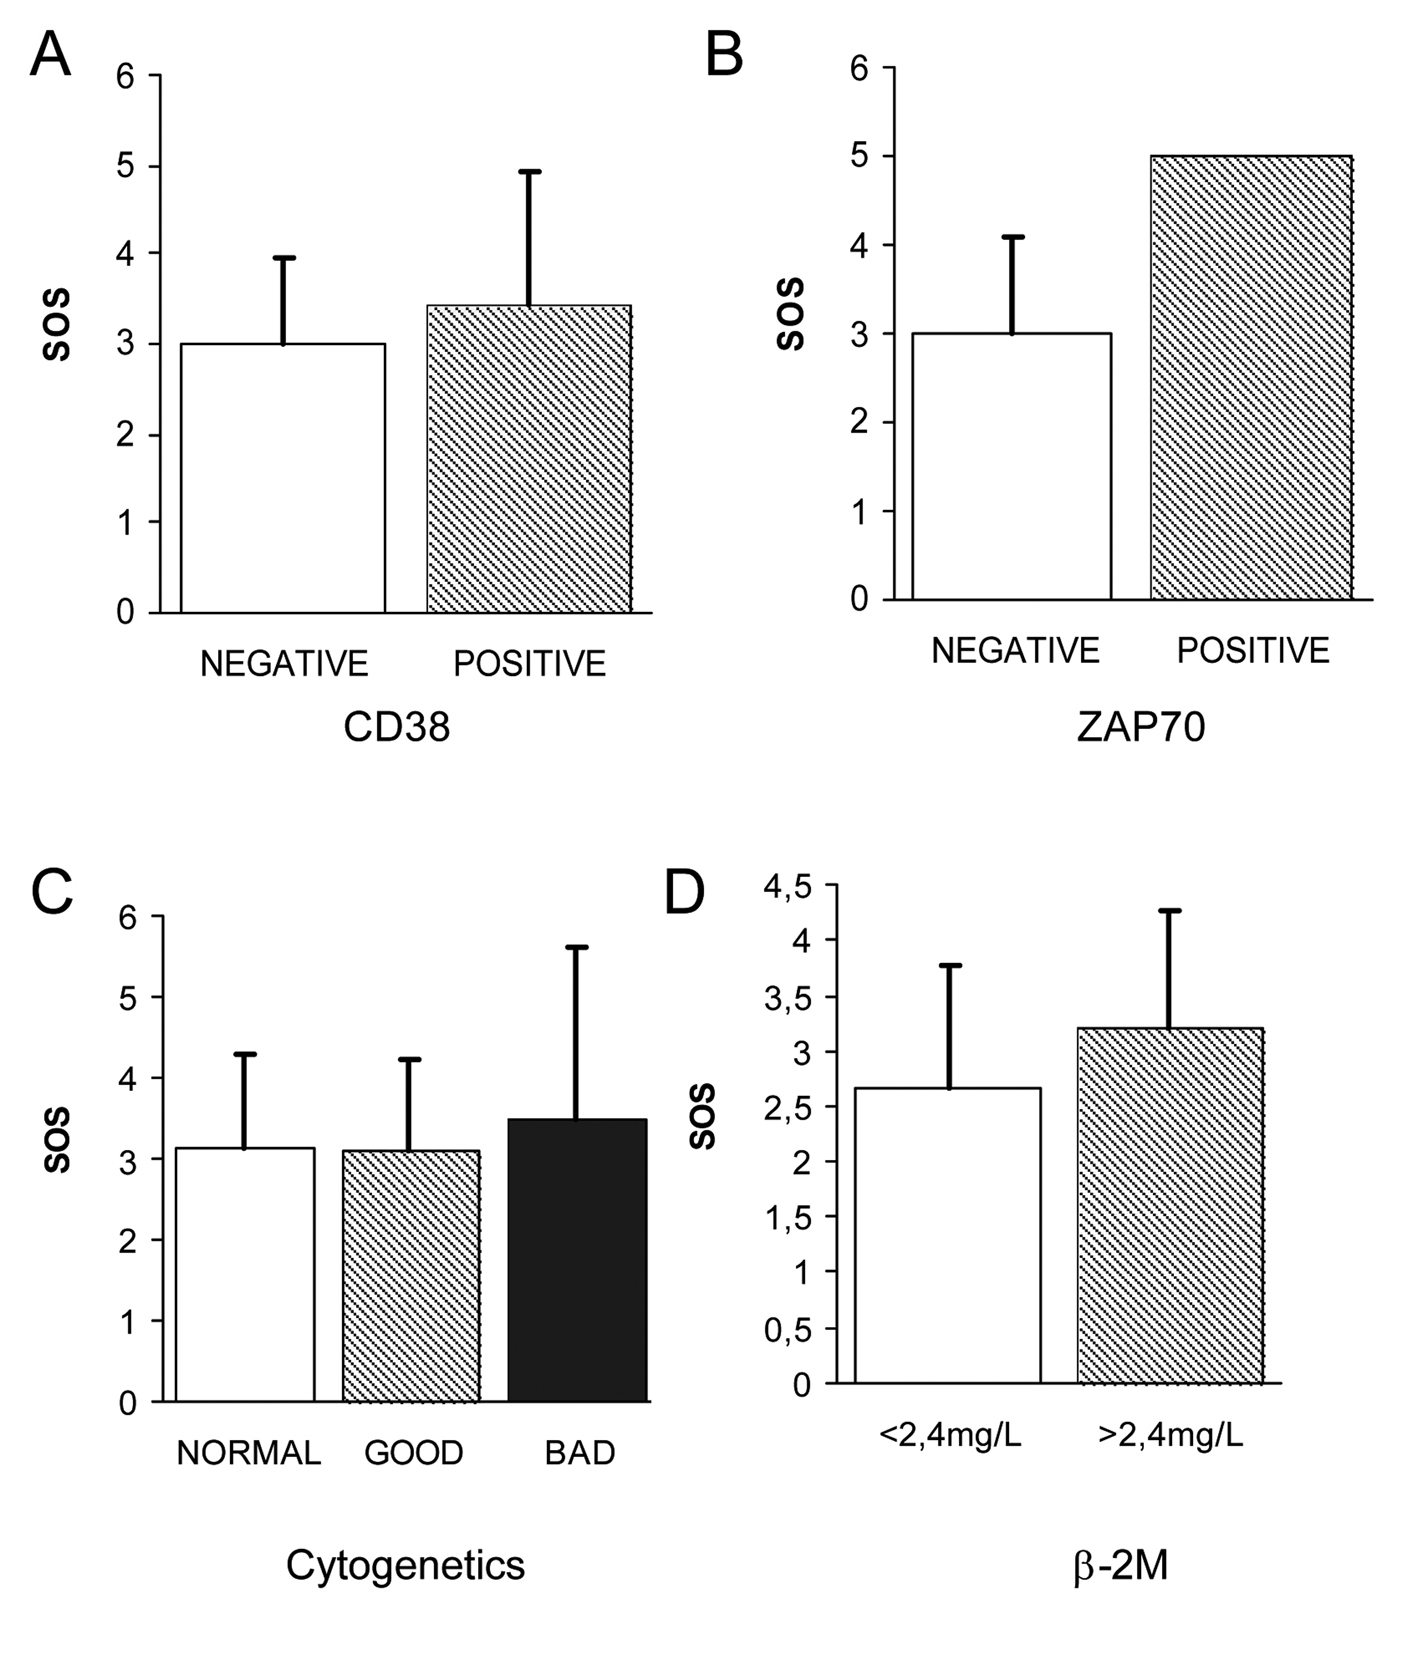
Figure 3. Correlation of OS biomarkers with evaluated prognostic of early stage CLL. (A) No significant differences could be observed in the levels of OS biomarkers CD38 (A), ZAP70 (B) and cytogenetic karyotipe (C) in relation to the prognostic. Regarding β-2M (D), a tendency of higher SOS could be observed in the group of patients with an adverse prognosis (β-2M > 2.4 mg/L) without significance.