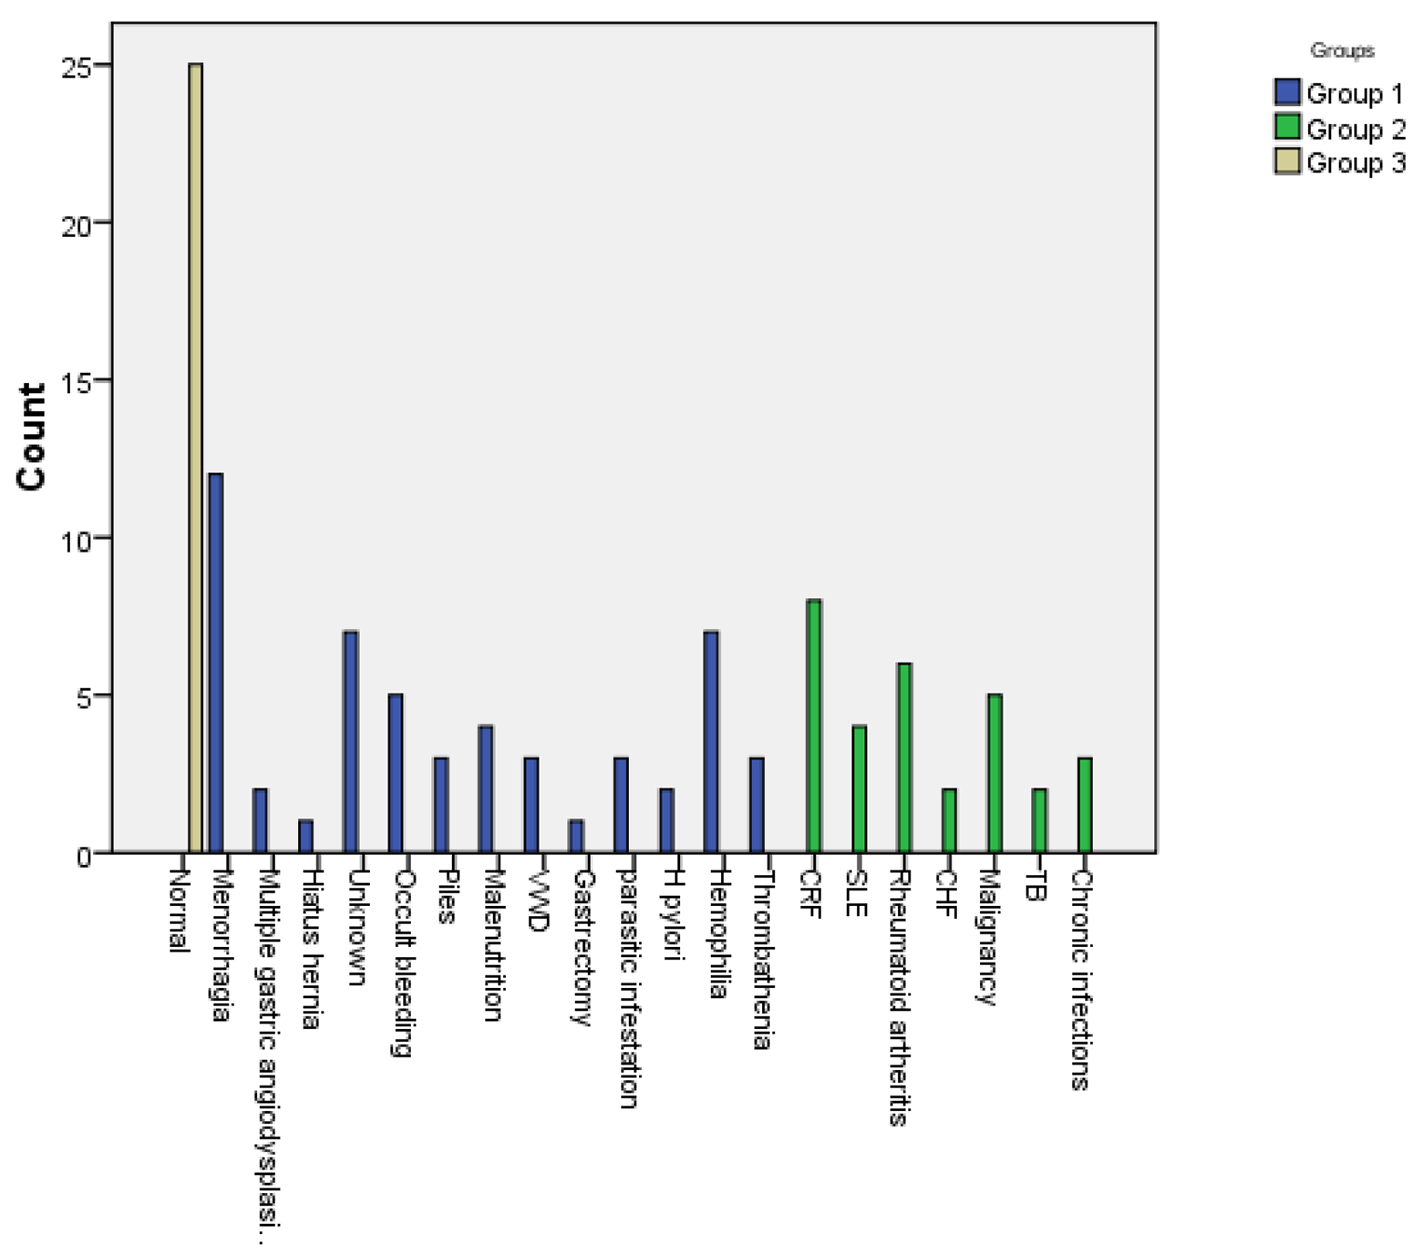
Figure 1. Causes of sideropenic anemias in the study patients.
| Journal of Hematology, ISSN 1927-1212 print, 1927-1220 online, Open Access |
| Article copyright, the authors; Journal compilation copyright, J Hematol and Elmer Press Inc |
| Journal website http://www.thejh.org |
Original Article
Volume 5, Number 3, September 2016, pages 83-93
Splenomegaly in Patients With Sideropenic Anemias: Clinical and Hematologic Significance
Figure
Tables
| Variable | Group 1 (n = 53) | Group 2 (n = 30) | Group 3 (n = 25) | P value |
|---|---|---|---|---|
| Data were presented as mean ± SD or as percentage from the total number. | ||||
| Demographics | ||||
| Age | ||||
| Mean ± SD | 30.89 ± 13.39 | 31.21 ± 15.15 | 31.01 ± 14.01 | 0.912 |
| Gender | ||||
| Male | 25 (47.2%) | 12 (40%) | 11 (44%) | 0.818 |
| Female | 28 (52.8%) | 18 (60%) | 14 (56 %) | |
| Residence | ||||
| Urban | 16 (30.2%) | 17 (56.6%) | 11 (44%) | 0.105 |
| Rural | 37 (69.8%) | 13 (43.4%) | 14 (56%) | |
| Governorate | ||||
| Assiut | 37 (69.8%) | 13 (43.3%) | 11 (44%) | |
| Qena | 3 (5.7%) | 11 (36.7%) | 2 (8%) | |
| Sohag | 0 (0%) | 6 (20%) | 0 (0%) | 0.000** |
| Luxor | 5 (9.4%) | 0 (0%) | 8 (32%) | |
| Al Menia | 6 (11.3%) | 0 (0% | 0 (0%) | |
| Aswan | 2 (3.8%) | 0 (0%) | 4 (16%) | |
| Occupation | ||||
| Housewife | 14 (26.4%) | 9 (30.0%) | 0 (0%) | |
| Farmer | 9 (17%) | 2 (6.7%) | 0 (0%) | |
| Employed | 9 (17%) | 10 (33.3%) | 16 (32.4%) | |
| Unemployed | 6 (11.3%) | 0 (0%) | 0 (0%) | |
| Student | 15 (28.3%) | 4 (13.3%) | 9 (36%) | |
| Retired | 0 (0%) | 5 (16.7%) | 0 (0%) | |
| Family | ||||
| Married | 8 (15.1%) | 4 (13.3%) | 3 (12%) | |
| Parent | 20 (37.7%) | 25 (83.3%) | 14 (56%) | |
| Single | 25 (47.2%) | 1 (3.3%) | 8 (32%) | |
| Main complaint | ||||
| Pallor, dizziness | 52 (98.2%) | 5 (16.7%) | 0 (0%) | |
| Repeated vomiting | 0 (0%) | 7 (23.3%) | 0 (0%) | |
| Non-hematological | 1 (1.8%) | 18 (60%) | 0 (0%) | |
| Asymptomatic | 0 (0%) | 0 (0%) | 25 (100%) | |
| Nutritional history | ||||
| Drinking tea | ||||
| Excessive | 37 (69.8%) | 15 (50%) | 9 (36%) | 0.013 |
| Mild | 16 (30.2%) | 15 (50%) | 16 (64%) | |
| Malnutrition | ||||
| Not present | 41 (77.4%) | 24 (80%) | 0 (0%) | 0.037 |
| Documented | 12 (22.6%) | 6 (20%) | 0 (0%) | |
| Signs | ||||
| Pallor | 53 (100%) | 28 (93.3%) | 0 (0%) | |
| Angular cheilitis | 24 (45.3%) | 2 (6.7%) | 0 (0%) | 0.000** |
| Kiolonychia | 17 (32.1%) | 0 (0%) | 0 (0%) | |
| Liver | ||||
| Impalpable | 53 (100%) | 17 (56.7%) | 25 (100%) | 0.000** |
| Hepatomegaly | 0 (0%) | 13 (43.3%) | 0 (0%) | |
| Spleen | ||||
| No splenomegaly | 47 (88.7%) | 18 (60%) | 25 (100%) | |
| Grade 0 | 0 (0%) | 6 (20%) | 0 (0%) | 0.000** |
| Grade 1 | 5 (9.4%) | 6 (20%) | 0 (0%) | |
| Grade 2 | 1 (1.9%) | 0 (0%) | 0 (0%) | |
| Ultrasound score | ||||
| Score 0 | 48 (90.5%) | 20 (66.7%) | 25 (100%) | 0.000* |
| Score 1 | 5 (9.4%) | 10 (33.3%) | 0 (0%) | |
| Parameter | Mean | Standard deviation | Standard error | 95% confidence interval for mean | Minimum | Maximum | |
|---|---|---|---|---|---|---|---|
| Lower bound | Upper bound | ||||||
| WBCs: white blood cells; Hb: hemoglobin; MCV: mean corpuscular volume; Plt: platelet; Retic: reticulocyte count; ESR: erythrocytic sedimentation rate; CRP: C-reactive protein. Duration of anemia in months. Data were presented as mean ± SD. P value was significant at 0.05 level. | |||||||
| WBCs (× 103/dL) | |||||||
| Group 1 | 6.27 | 2.576 | 0.354 | 5.56 | 6.98 | 3 | 12 |
| Group 2 | 8.55 | 3.281 | 0.599 | 7.32 | 9.78 | 4 | 15 |
| Group 3 | 7.32 | 2.824 | 0.565 | 6.15 | 8.49 | 4 | 12 |
| Hb (g/dL) | |||||||
| Group 1 | 7.579 | 2.0649 | 0.2836 | 7.010 | 8.148 | 3.2 | 10.0 |
| Group 2 | 8.387 | 1.2412 | 0.2266 | 7.923 | 8.850 | 6.5 | 11.0 |
| Group 3 | 12.63 | 1.0319 | 0.2064 | 12.206 | 13.058 | 11.5 | 14.5 |
| Plts (× 103/dL) | |||||||
| Group 1 | 447.1 | 193.356 | 26.559 | 393.84 | 500.43 | 210 | 923 |
| Group 2 | 279.6 | 79.079 | 14.438 | 250.10 | 309.16 | 155 | 400 |
| Group 3 | 227.2 | 59.636 | 11.927 | 202.62 | 251.86 | 165 | 380 |
| MCV (fL) | |||||||
| Group 1 | 67.38 | 10.367 | 1.424 | 64.52 | 70.23 | 44 | 78 |
| Group 2 | 86.33 | 4.943 | 0.903 | 84.49 | 88.18 | 77 | 94 |
| Group 3 | 86.04 | 4.087 | 0.817 | 84.35 | 87.73 | 76 | 92 |
| Retic (%) | |||||||
| Group 1 | 1.840 | 1.0454 | 0.1436 | 1.551 | 2.128 | 0.7 | 3.8 |
| Group 2 | 0.950 | 0.5625 | 0.1027 | 0.740 | 1.160 | 0.2 | 2.0 |
| Group 3 | 1.728 | 0.3221 | 0.0644 | 1.595 | 1.861 | 0.8 | 2.5 |
| S. iron (μg/dL) | |||||||
| Group 1 | 24.68 | 1.554 | 0.213 | 24.25 | 25.11 | 22 | 28 |
| Group 2 | 28.80 | 4.838 | 0.883 | 26.99 | 30.61 | 22 | 40 |
| Group 3 | 97.52 | 22.664 | 4.533 | 88.16 | 106.88 | 50 | 135 |
| TIBC (μg/dL) | |||||||
| Group 1 | 389.2 | 41.963 | 5.764 | 377.70 | 400.83 | 300 | 480 |
| Group 2 | 210.2 | 46.024 | 8.403 | 193.01 | 227.39 | 13 | 280 |
| Group 3 | 319.8 | 42.346 | 8.644 | 301.99 | 337.76 | 230 | 380 |
| Duration of SA (ms) | |||||||
| Group 1 | 5.25 | 7.746 | 1.064 | 3.11 | 7.38 | 1 | 36 |
| Group 2 | 5.97 | 1.771 | 0.323 | 5.31 | 6.63 | 2 | 9 |
| Group 3 | 0.00 | 0.000 | 0.000 | 0.00 | 0.00 | 0 | 0 |
| ESR (mm/h) | |||||||
| Group 1 | 22.17 | 6.345 | 0.872 | 20.42 | 23.92 | 13 | 36 |
| Group 2 | 84.70 | 38.896 | 7.101 | 70.18 | 99.22 | 27 | 135 |
| Group 3 | 11.44 | 3.743 | 0.749 | 9.90 | 12.98 | 5 | 18 |
| CRP | |||||||
| Group 1 | 1.950 | 3.1043 | 0.4264 | 1.094 | 2.805 | 0.0 | 11.0 |
| Group 2 | 23.33 | 5.8329 | 1.0649 | 21.155 | 25.511 | 13.0 | 34.0 |
| Group 3 | 1.752 | 2.4324 | 0.4865 | 0.748 | 2.756 | 0.0 | 8.0 |
| Dependent variable | (I) Group | (J) Group | Mean difference (I-J) | Standard error | Sig. | 95% confidence interval | |
|---|---|---|---|---|---|---|---|
| Lower bound | Upper bound | ||||||
| WBCs: white blood cells; Hb: hemoglobin; MCV: mean corpuscular volume; Plt: platelet; Retic: reticulocyte count; ESR: erythrocytic sedimentation rate; CRP: C-reactive protein. *The mean difference was significant at 0.05 level. | |||||||
| WBCs | Group 3 | Group 1 | 1.050 | 0.690 | 0.285 | -0.59 | 2.69 |
| Group 2 | -1.230 | 0.770 | 0.251 | -3.06 | 0.60 | ||
| Hb | Group 3 | Group 1 | 5.0528* | 0.4046 | 0.000 | 4.091 | 6.015 |
| Group 2 | 4.2453* | 0.4516 | 0.000 | 3.172 | 5.319 | ||
| Plts | Group 3 | Group 1 | -219.892* | 35.206 | 0.000 | -303.59 | -136.19 |
| Group 2 | -52.393 | 39.294 | 0.380 | -145.81 | 41.03 | ||
| MCV | Group 3 | Group 1 | 18.663* | 1.938 | 0.000 | 14.06 | 23.27 |
| Group 2 | -0.293 | 2.163 | 0.990 | -5.44 | 4.85 | ||
| Retic | Group 3 | Group 1 | -0.1116 | 0.1960 | 0.837 | -0.577 | 0.354 |
| Group 2 | 0.7780* | 0.2187 | 0.002 | 0.258 | 1.298 | ||
| S. iron | Group 3 | Group 1 | 72.841* | 2.713 | 0.000 | 66.39 | 79.29 |
| Group 2 | 68.720* | 3.029 | 0.000 | 61.52 | 75.92 | ||
| TIBC | Group 3 | Group 1 | -69.389* | 10.633 | 0.000 | -94.67 | -44.11 |
| Group 2 | 109.675* | 11.835 | 0.000 | 81.53 | 137.82 | ||
| Duration of SA | Group 3 | Group 1 | -5.245* | 1.342 | 0.000 | -8.44 | -2.06 |
| Group 2 | -5.967* | 1.497 | 0.000 | -9.53 | -2.41 | ||
| ESR | Group 3 | Group 1 | -10.730 | 5.095 | 0.094 | -22.84 | 1.38 |
| Group 2 | -73.260* | 5.687 | 0.000 | -86.78 | -59.74 | ||
| CRP | Group 3 | Group 1 | -0.1976 | 0.9559 | 0.977 | -2.470 | 2.075 |
| Group 2 | -21.5813* | 1.0669 | 0.000 | -24.118 | -19.045 | ||
| Variable | Group 1 ( n = 53) | Group 2 (n = 30) | P value |
|---|---|---|---|
| Degree of anemia | |||
| Non-anemic | 0 (0%) | 0 (0%) | 0.000** |
| Mild | 0 (0%) | 2 (6.7%) | |
| Moderate | 28 (52.8%) | 24 (80%) | |
| Severe | 25 (47.2%) | 4 (13.3%) | |
| Treatment | 0.000** | ||
| No treatment | 0 (0%) | 9 (30%) | |
| Parenteral iron | 11 (20.8%) | 0 (0%) | |
| Oral iron | 40 (75.5%) | 8 (26.7%) | |
| Blood transfusion | 2 (3.8%) | 5 (16.7%) | |
| Oral iron + erythropoietin | 0 (0%) | 8 (26.7%) |
| Splenomegaly** | Sensitivity (95% CI) | Specificity (95% CI) | Positive predictive value (95% CI) | Negative predictive value (95% CI) | P value |
|---|---|---|---|---|---|
| *P value < 0.05. **No splenomegaly found in group 3. | |||||
| Group 1 (n = 53) | 10% (0.04 - 0.23) | 66.7% (0.13 - 0.98) | 83% (0.36 - 0.99) | 4.25% (0.01 - 0.16) | 0.03* |
| Group 2 (n = 30) | 40% (0.22 - 0.61) | 40% (0.07 - 0.83) | 76% (0.46 - 0.93) | 11.7% (0.02 - 0.38) | |
| Variable | No splenomegaly, 48 (90.6%) | Splenomegaly, 5 (9.4%) | P value |
|---|---|---|---|
| P value was significant at 0.05 level. | |||
| Gender | 0.060 | ||
| Male | 21 (43.7%) | 4 (80%) | |
| Female | 27 (56.3%) | 1 (20%) | |
| Residence | 0.595 | ||
| Urban | 15 (31.2%) | 1 (20%) | |
| Rural | 33 (68.8%) | 4 (80%) | |
| Nutritional history | |||
| Drinking tea | 0.405 | ||
| Excessive | 32 (66.7%) | 5 (100%) | |
| Mild | 16 (33.3%) | 0 (0%) | |
| Malnutrition | 0.000** | ||
| Not present | 41 (85.4%) | 0 (0%) | |
| Documented | 7 (14.6%) | 5 (100%) | |
| Signs | |||
| Angular cheilitis | 0.060 | ||
| Present | 20 (41.7%) | 4 (80%) | |
| Absent | 28 (58.3%) | 1 (20%) | |
| Koilonychias | 0.000** | ||
| Present | 11 (22.9%) | 5 (100%) | |
| Absent | 37 (77.1%) | 0 (0%) | |
| Liver | 0.000** | ||
| Impalpable | 53 (100%) | 5 (100%) | |
| Hepatomegaly | 0 (0%) | 0 (0%) | |
| Degree of anemia | 0.000** | ||
| Mild | 0 (0%) | 0 (0%) | |
| Moderate | 28 (58.3%) | 0 (0%) | |
| Severe | 20 (41.7%) | 5 (100%) | |