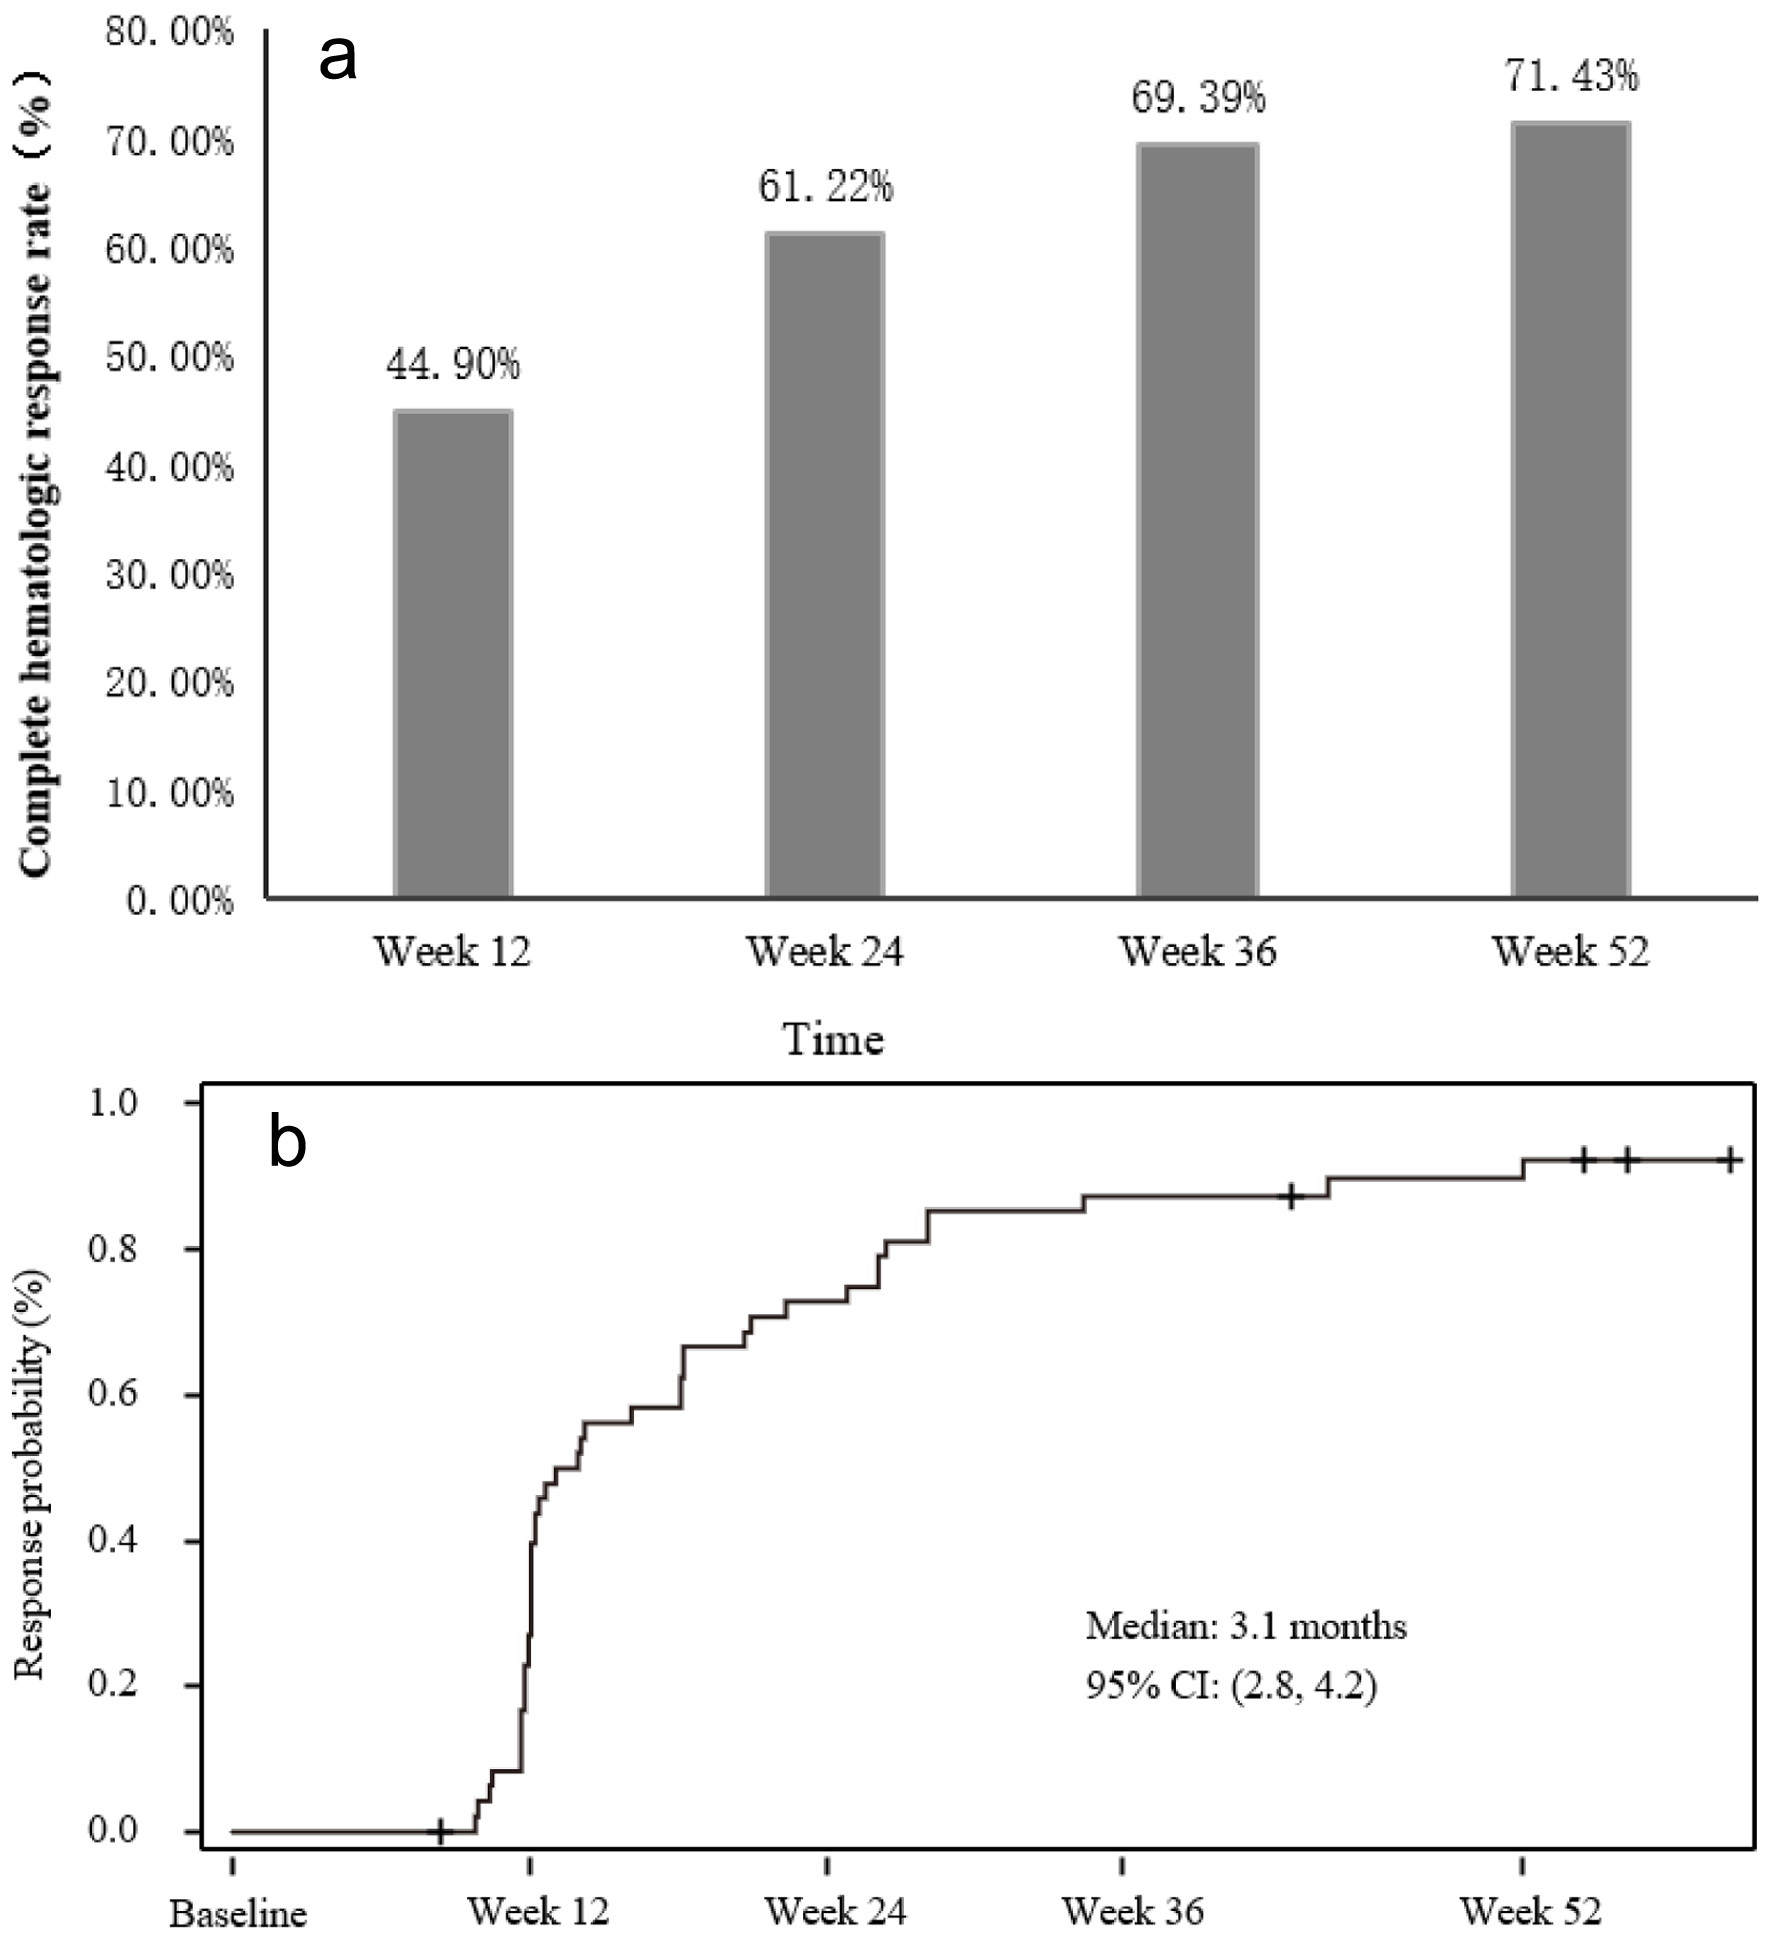
Figure 1. Complete hematological response (CHR) rates and time to CHR. (a) CHR rates at different assessment visits. (b) Graph depicting time to CHR.
| Journal of Hematology, ISSN 1927-1212 print, 1927-1220 online, Open Access |
| Article copyright, the authors; Journal compilation copyright, J Hematol and Elmer Press Inc |
| Journal website https://www.thejh.org |
Original Article
Volume 13, Number 1-2, April 2024, pages 12-22
Effective Management of Polycythemia Vera With Ropeginterferon Alfa-2b Treatment
Figures
Tables
| aSpleen size = length × thickness, which was measured by ultrasound. Splenomegaly was recorded in ultrasound reports, being judged mainly based on spleen length. bPatients with hematocrit > 45% were generally treated with phlebotomy or erythrocyte apheresis. ECOG: Eastern Cooperative Oncology Group; HU: hydroxyurea; IFN: interferon; PV: polycythemia vera; SD: standard deviation. | |
| Age (years), mean (SD) | 53.0 (10.9) |
| Sex | |
| Male | 31 (63.3%) |
| Female | 18 (36.7%) |
| ECOG performance status score | |
| 0 | 42 (85.7%) |
| 1 | 7 (14.3%) |
| PV diagnosis (months), mean (SD) | 44.43 (59.0) |
| History of HU treatment | |
| Intolerance | 49 (100%) |
| Resistance | 0 |
| Total duration of HU treatment (days), median (min. - max.) | 125.0 (1 - 7,344) |
| History of prior IFN treatment, N (%) | 30 (61.2%) |
| Total time of prior IFN treatment (days), median (min. - max.) | 153.5 (1 - 6,552) |
| History of phlebotomy or erythrocyte apheresis, N (%) | 23 (46.9%) |
| History of hemorrhage or thrombosis | |
| Previous hemorrhage | 6 (12.2%) |
| Previous thrombosis | 9 (18.4%) |
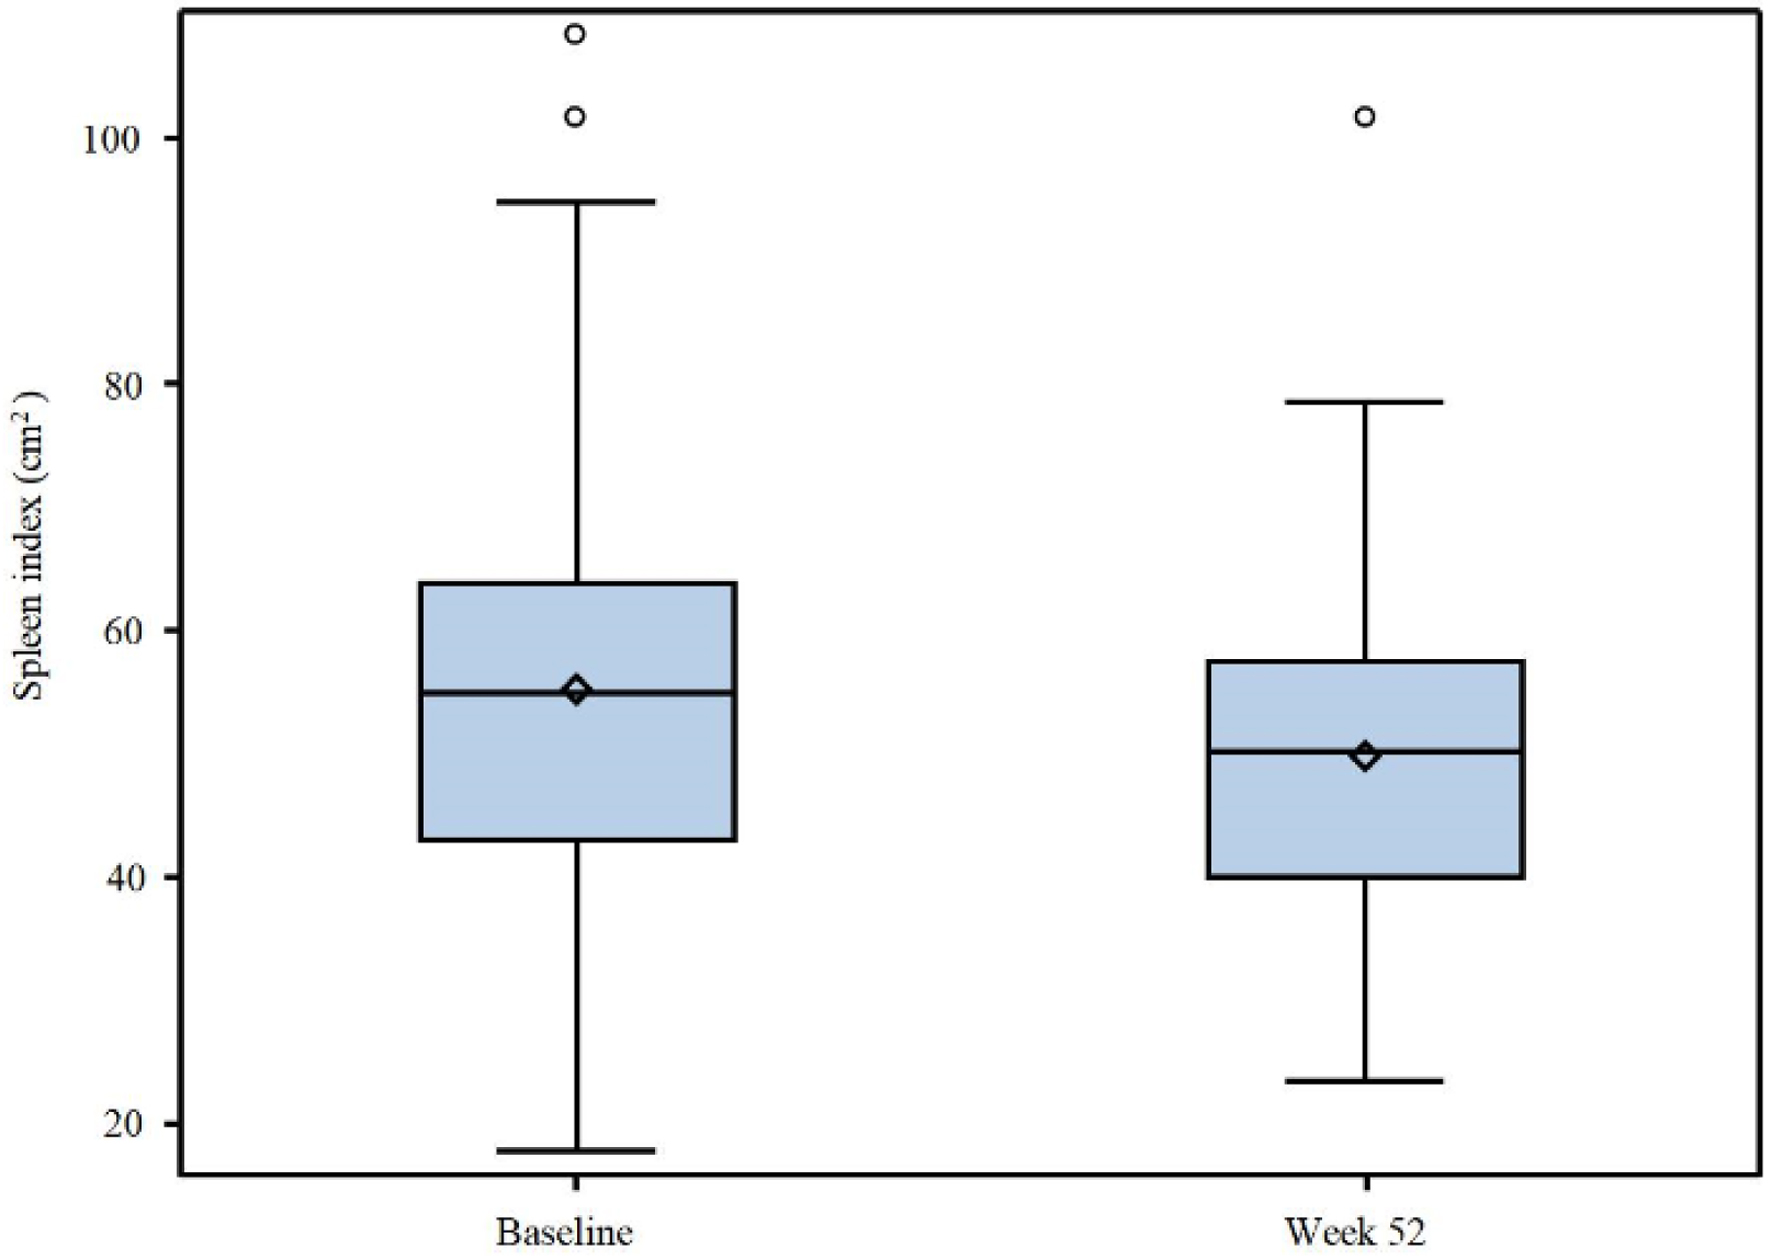
| Spleen size (cm2)a, mean (SD) | 55.6 (18.8) |
| Patients with splenomegaly determined by ultrasounda, N (%) | 36 (73.5%) |
| JAK2V617F mutation | 49 (100%) |
| Baseline parameters, mean (SD) | |
| Hematocrit (%) | 46.0 (5.3)b |
| Leukocytes (109/L) | 11.4 (9.4) |
| Platelets (109/L) | 478.5 (238.8) |
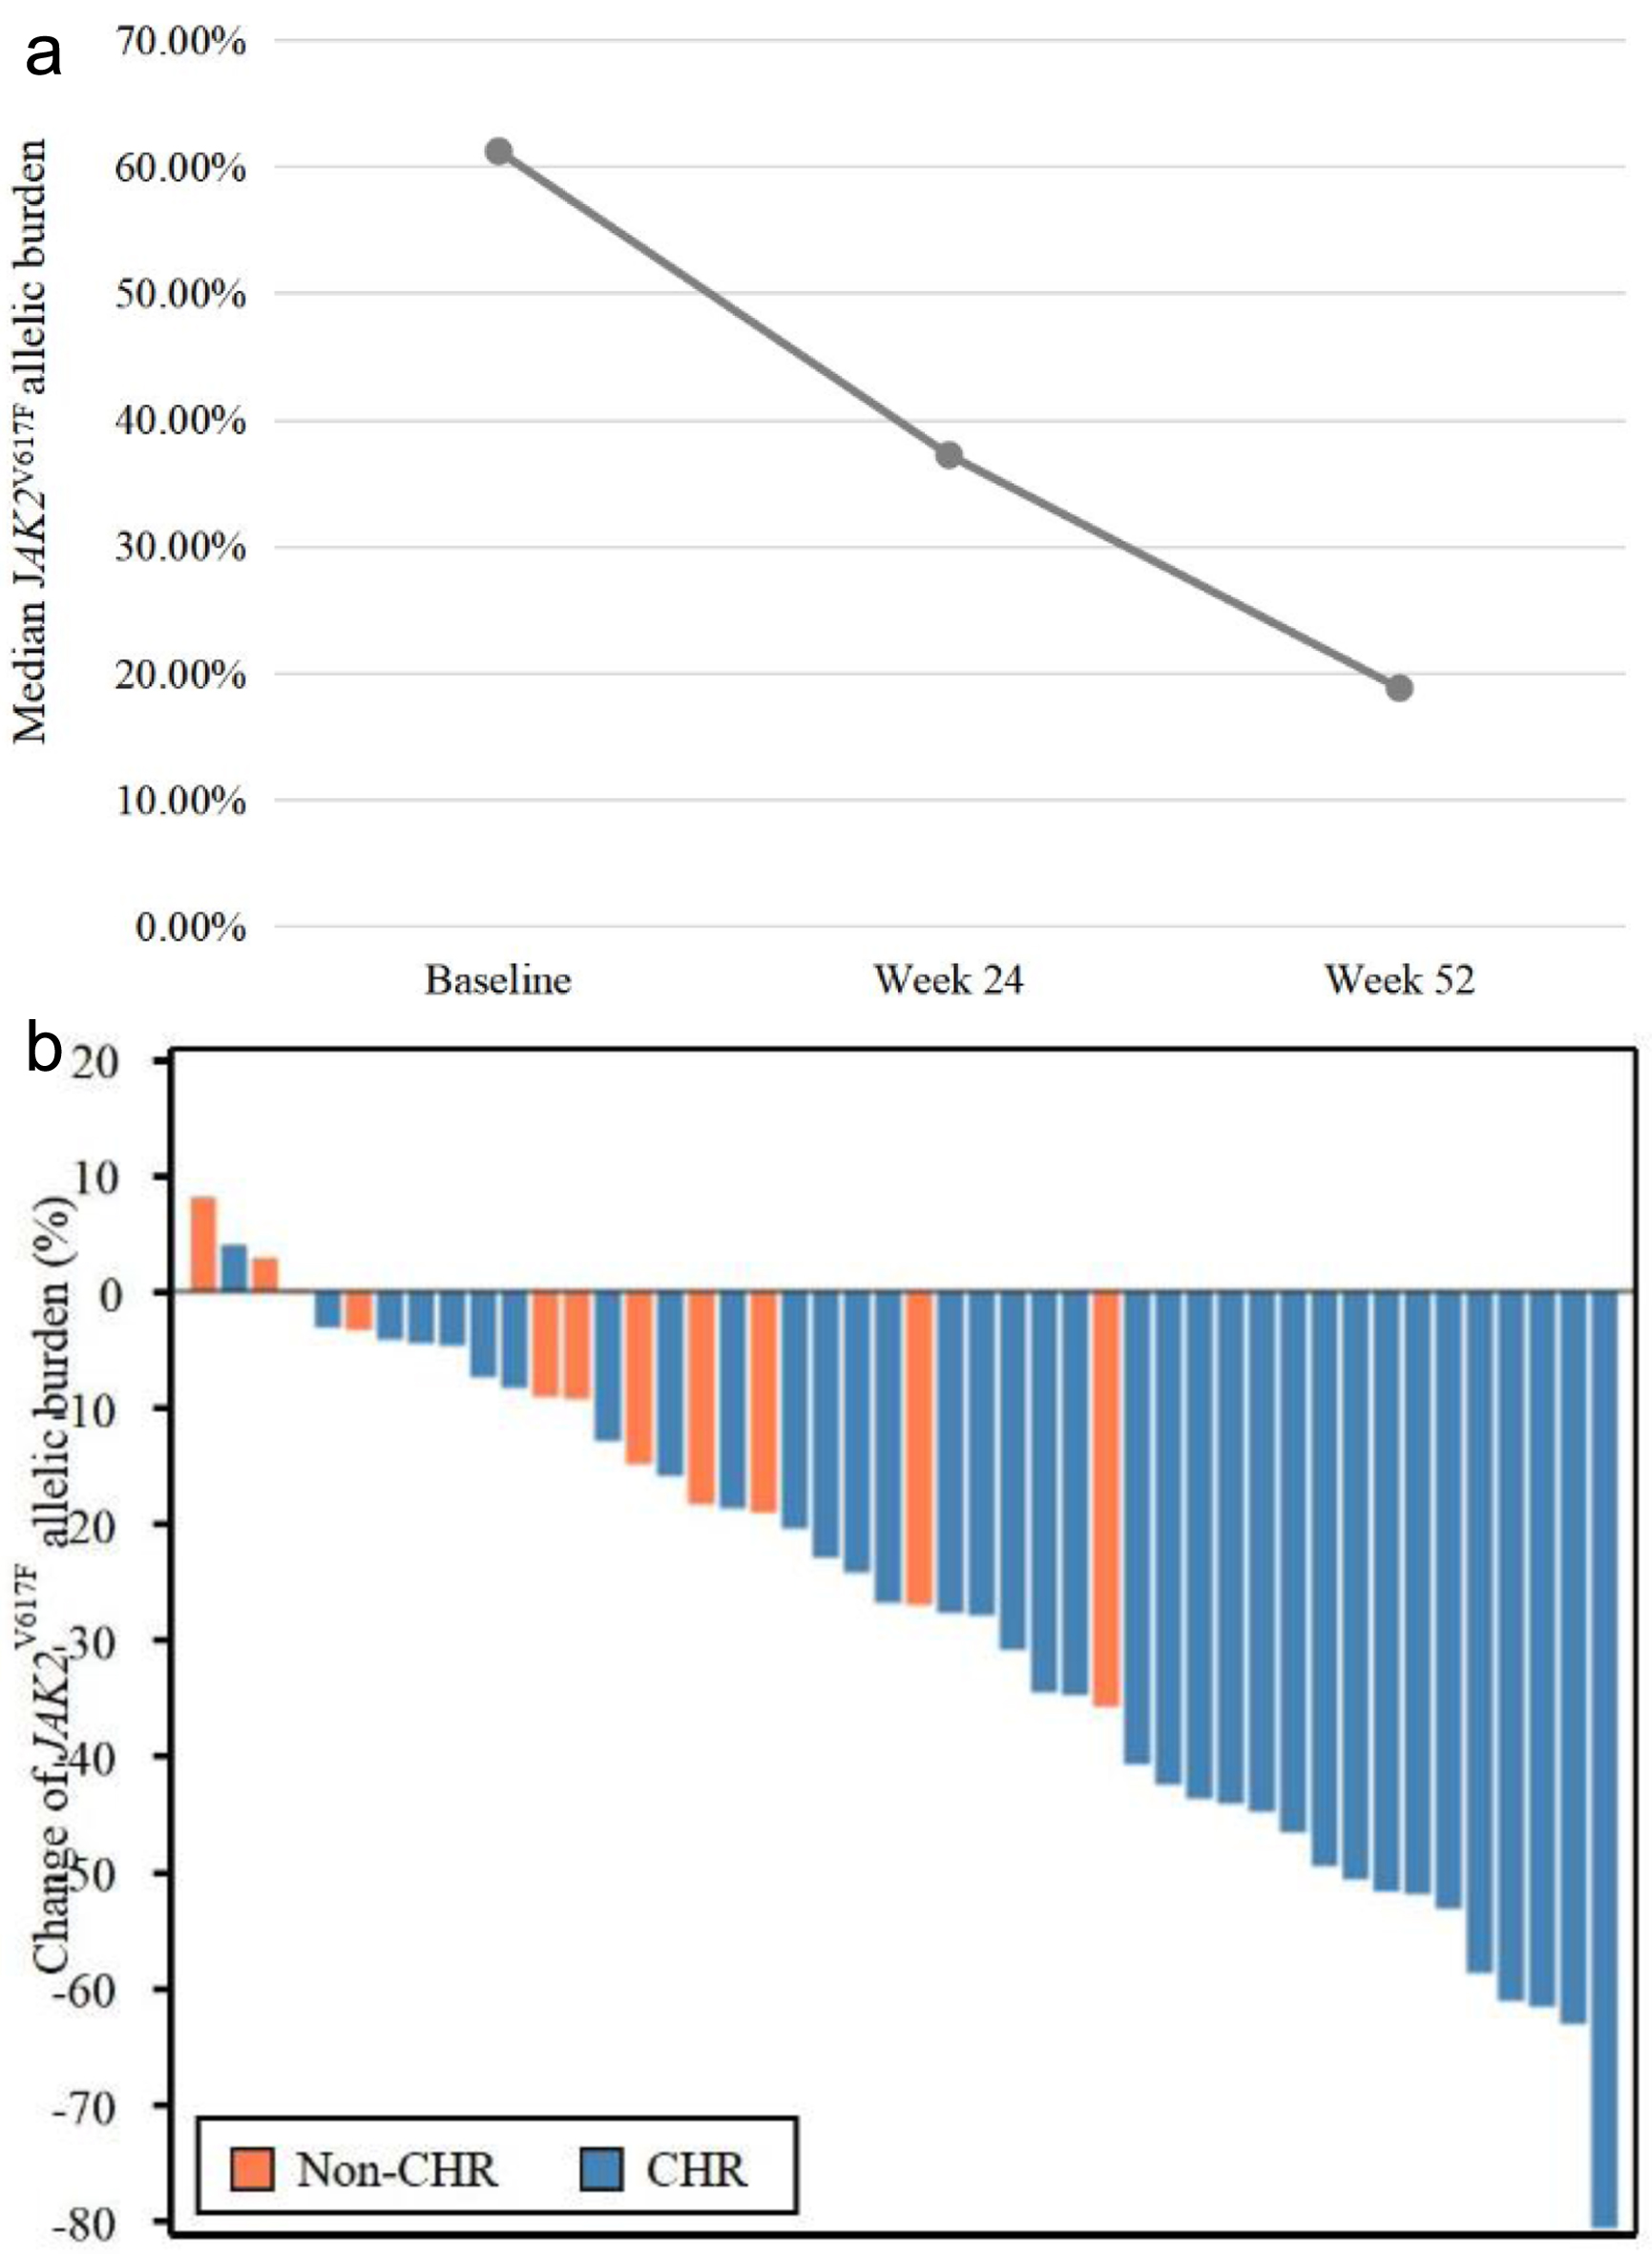
| JAK2V617F allelic burden (%) | 58.5 (25.3) |
| System organ class preferred term | Patients (N = 49) | |||||
|---|---|---|---|---|---|---|
| Grade 1 | Grade 2 | Grade 3a | Grade 4 | Grade 5 | Total | |
| n (%) | n (%) | n (%) | n (%) | n (%) | n (%) | |
| aFifteen grade 3 AEs were observed in 11 patients. Among them, possible treatment-related TEAEs were observed in eight patients. bFour patients (8.2%) had a prior history of grade 1 alanine aminotransferase increase. cOne patient (2.0%) had a prior history of grade 1 aspartate aminotransferase increase. dThree patients received G-CSF treatment for decrease in the white blood count during the study. eThree patients (6.1%) had a prior history of grade 1 gamma-glutamyl transferase increase. fTwo patients (4.1%) had a prior history of grade 1 bilirubin increase. COVID-19: coronavirus disease 2019. | ||||||
| Metabolism and nutrition disorder | ||||||
| Hyperuricemia | 22 (44.9%) | 0 | 0 | 0 | 0 | 22 (44.9%) |
| Hypertriglyceridemia | 15 (30.6%) | 0 | 3 (6.1%) | 0 | 0 | 18 (36.7%) |
| Decreased appetite | 5 (10.2%) | 0 | 0 | 0 | 0 | 5 (10.2%) |
| Infections and infestations | ||||||
| Urinary tract infection | 6 (12.2%) | 6 (12.2%) | 0 | 0 | 0 | 12 (24.5%) |
| COVID-19 | 5 (10.2%) | 1 (2.0%) | 0 | 0 | 0 | 6 (12.2%) |
| Upper respiratory tract infection | 3 (6.1%) | 3 (6.1%) | 0 | 0 | 0 | 6 (12.2%) |
| General disorders and administration site conditions | ||||||
| Asthenia | 7 (14.3%) | 4 (8.2%) | 0 | 0 | 0 | 11 (22.4%) |
| Pyrexia | 5 (10.2%) | 1 (2.0%) | 0 | 0 | 0 | 6 (12.2%) |
| Skin and subcutaneous tissue disorders | ||||||
| Alopecia | 9 (18.4%) | 0 | 0 | 0 | 0 | 9 (18.4%) |
| Renal and urinary disorders | ||||||
| Proteinuria | 8 (16.3%) | 2 (4.1%) | 0 | 0 | 0 | 10 (20.4%) |
| Musculoskeletal and connective tissue disorders | ||||||
| Back pain | 4 (8.2%) | 1 (2.0%) | 0 | 0 | 0 | 5 (10.2%) |
| Hepatobiliary disorders | ||||||
| Hepatic steatosis | 8 (16.3%) | 0 | 0 | 0 | 0 | 8 (16.3%) |
| Nervous system disorders | ||||||
| Hypoesthesia | 6 (12.2%) | 0 | 0 | 0 | 0 | 6 (12.2%) |
| Investigations | ||||||
| Elevated alanine aminotransferaseb | 21 (42.9%) | 6 (12.2%) | 1 (2.0%) | 0 | 0 | 28 (57.1%) |
| Elevated aspartate aminotransferasec | 21 (42.9%) | 7 (14.3%) | 0 | 0 | 0 | 28 (57.1%) |
| Lowered white blood cell countd | 8 (16.3%) | 13 (26.5%) | 2 (4.1%) | 0 | 0 | 23 (46.9%) |
| Increased gamma-glutamyl transferasee | 12 (24.5%) | 6 (12.2%) | 2 (4.1%) | 0 | 0 | 20 (40.8%) |
| Decreased neutrophil count | 8 (16.3%) | 8 (16.3%) | 2 (4.1%) | 0 | 0 | 18 (36.7%) |
| Decreased lymphocyte count | 2 (4.1%) | 7 (14.3%) | 3 (6.1%) | 0 | 0 | 12 (24.5%) |
| Increased beta 2 microglobulin urine | 12 (24.5%) | 0 | 0 | 0 | 0 | 12 (24.5%) |
| Decreased platelet count | 9 (18.4%) | 1 (2.0%) | 0 | 0 | 0 | 10 (20.4%) |
| Decreased weight | 9 (18.4%) | 3 (6.1%) | 0 | 0 | 0 | 12 (24.5%) |
| Increased blood bilirubinf | 5 (10.2%) | 1 (2.0%) | 0 | 0 | 0 | 6 (12.2%) |
| Increased blood alkaline phosphatase | 4 (8.2%) | 2 (4.1%) | 0 | 0 | 0 | 6 (12.2%) |
| White blood cells urine positive | 6 (12.2%) | 1 (2.0%) | 0 | 0 | 0 | 7 (14.3%) |
| Increased blood lactate dehydrogenase | 7 (14.3%) | 0 | 0 | 0 | 0 | 7 (14.3%) |
| Antinuclear antibody positive | 8 (16.3%) | 0 | 0 | 0 | 0 | 8 (16.3%) |
| Anemia | 8 (16.3%) | 3 (6.1%) | 0 | 0 | 0 | 11 (22.4%) |
| PK parameters | Starting dose (250 µg) | After intra-patient dose titrations (500 µg) |
|---|---|---|
| Tmax: median time to the maximum serum ropeginterferon alfa-2b concentration; T1/2: terminal-phase half-life; Cmax: maximum serum concentration; Cmax ss: steady state of maximum serum concentration; AUC0-t: area under the serum concentration-time curve from time 0 to the time of the last quantifiable sample within a dosing interval; AUC0-tau: area under the serum concentration-time curve during the dosing interval after repeated dosing; PK: pharmacokinetic; SD: standard deviation. | ||
| Cmax or Cmax ss (pg/mL), mean ± SD | 18,632.0 ± 10,288.2 | 59,534.1 ± 22,498.3 |
| Tmax (h), median (min. - max.) | 96 (48.0 - 168.0) | 96 (48.0 - 210.6) |
| AUC0-t or AUC0-tau (h × pg/mL), mean ± SD | 3,960,705.9 ± 2,416,333.4 | 15,293,612.2 ± 5,625,792.8 |
| T1/2 (h), mean ± SD | 144.7 ± 100.0 | - |