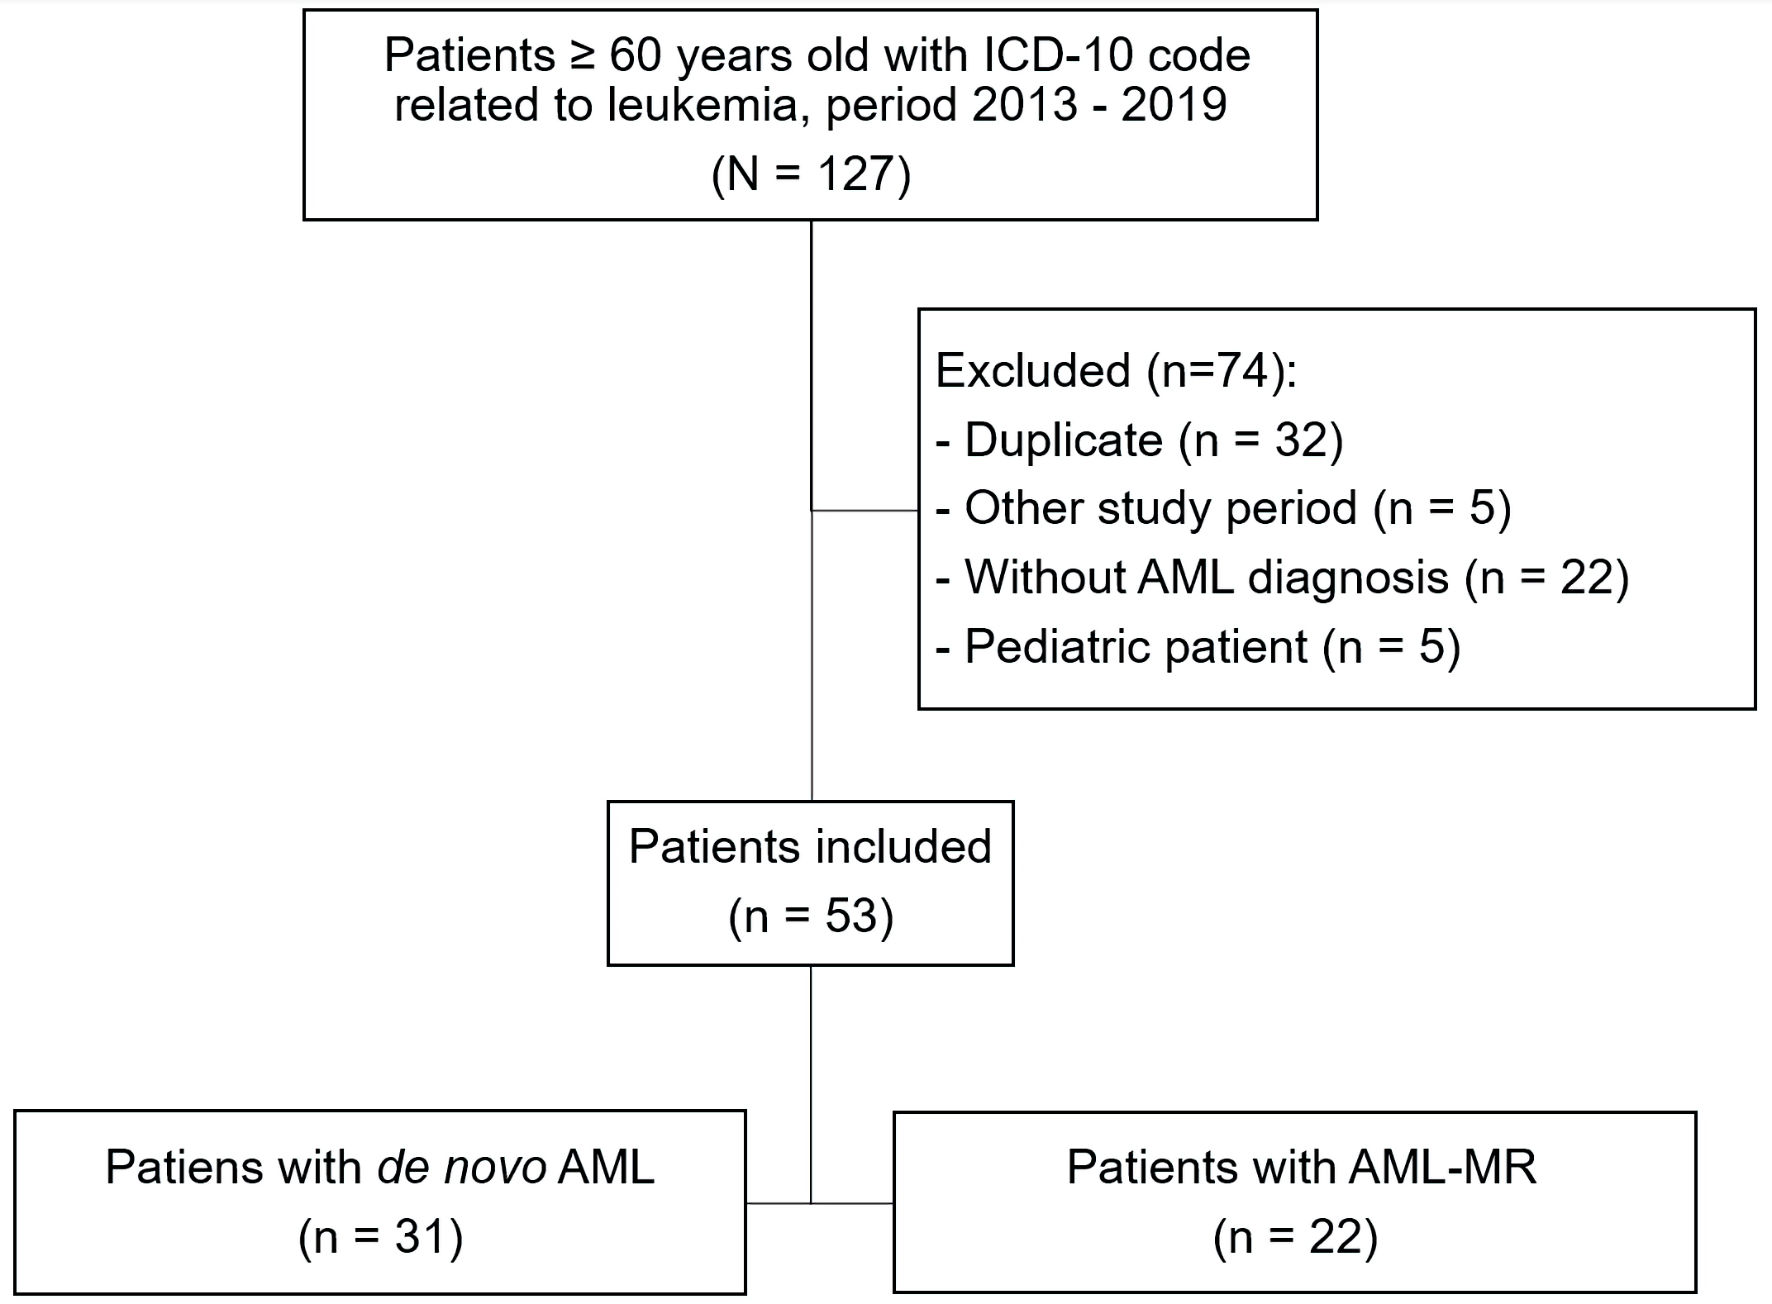
Figure 1. Flowchart of patient selection in the study. ICD-10: the International Classification of Diseases, 10th Revision; AML: acute myeloid leukemia; AML-MR: acute myeloid leukemia myelodysplasia-related.
| Journal of Hematology, ISSN 1927-1212 print, 1927-1220 online, Open Access |
| Article copyright, the authors; Journal compilation copyright, J Hematol and Elmer Press Inc |
| Journal website https://www.thejh.org |
Original Article
Volume 12, Number 1, February 2023, pages 7-15
Survival in Elderly Patients Diagnosed With Acute Myeloid Leukemia: A Hospital-Based Study
Figures
Tables
| Characteristic | Type of leukemia | P value | |
|---|---|---|---|
| De novo, n (%) (n = 31) | AML-MR, n (%) (n = 22) | ||
| AML-MR: acute myeloid leukemia myelodysplasia-related; ECOG: Eastern Cooperative Oncology Group; IQR: interquartile range. | |||
| Median age at diagnosis (IQR) (years) | 70 (66 - 77) | 73 (68 - 78) | 0.270 |
| Female sex | 16 (51.6%) | 10 (45.5%) | 0.659 |
| Extramedullary involvement | 5 (16.1%) | 1 (4.5%) | 0.195 |
| Median white blood count (IQR) (/µL) | 12,010 (2,100 - 45,530) | 3,995 (1,070 - 12,490) | 0.080 |
| ECOG performance status | |||
| 1 | 20 (64.5%) | 12 (54.5%) | 0.070 |
| 2 | 1 (3.2%) | 6 (27.3%) | |
| 3 | 6 (19.4%) | 3 (13.6%) | |
| 4 | 4 (12.9%) | 1 (4.5%) | |
| Charlson comorbidity index (CCI) | |||
| 4 | 8 (25.8%) | 3 (13.6%) | 0.282 |
| ≥ 5 | 23 (74.2%) | 19 (86.4%) | |
| Drug therapy | |||
| Intensive chemotherapy | 17 (54.8%) | 3 (13.6%) | 0.001 |
| Less-intensive chemotherapy | 9 (29.0%) | 17 (77.3%) | |
| No chemotherapy | 5 (16.1%) | 2 (9.1%) | |
| Support treatments | |||
| Erythropoietin | 1 (3.2%) | 8 (36.4%) | 0.002 |
| Blood component transfusion | 16 (51.6%) | 18 (81.8%) | 0.024 |
| Palliative care | 17 (54.8%) | 11 (50.0%) | 0.728 |
| ICU management | 25 (80.6%) | 17 (77.3%) | 0.513 |
| Median survival (IQR) (days) | 222 (28 - 659) | 200 (54 - 360) | 0.801 |
| Characteristic | Chemotherapy scheme | OR (95% CI) | P value | |
|---|---|---|---|---|
| Intensive, n (%), (n = 20) | Less-intensive, n (%), (n = 26) | |||
| aData available (n = 27). ECOG: Eastern Cooperative Oncology; IQR: interquartile range; CI: confidence interval. | ||||
| Type of leukemia | ||||
| De novo | 17 (85%) | 9 (34.6%) | 1 | < 0.001 |
| Myelodysplasia-related | 3 (15%) | 17 (65.4%) | 0.9 (0.014 - 0.47) | |
| ECOG performance status | ||||
| 1 | 19 (95%) | 12 (46.2%) | 1 | < 0.001 |
| ≥ 2 | 1 (5%) | 14 (53.8%) | 0.05 (0.001 - 0.39) | |
| Charlson comorbidity index (CCI) | ||||
| 4 | 10 (50%) | 1 (3.8%) | 1 | < 0.001 |
| ≥ 5 | 10 (50%) | 25 (96.2%) | 0.04 (0.0008 - 0.36) | |
| Minimum residual disease (MRD)a | 0.276 | |||
| Detected | 8 (57.1%) | 10 (76.9%) | 0.4 (0.05 - 2.7) | |
| Not detected | 6 (42.9%) | 3 (23.1%) | 1 | |
| Salvage chemotherapy | 0.086 | |||
| Yes | 12 (60%) | 9 (34.6%) | 2.8 (0.72 - 11.23) | |
| No | 8 (40%) | 17 (65.4%) | 1 | |
| Chemotherapy (n = 46) | No chemotherapy (n = 7) | P value | |||
|---|---|---|---|---|---|
| Intensive | Less-intensive | P value | |||
| aAdjusted by ECOG performance status, Charlson comorbidity index (CCI), and type of diagnosis. IQR: interquartile range; ECOG: Eastern Cooperative Oncology. | |||||
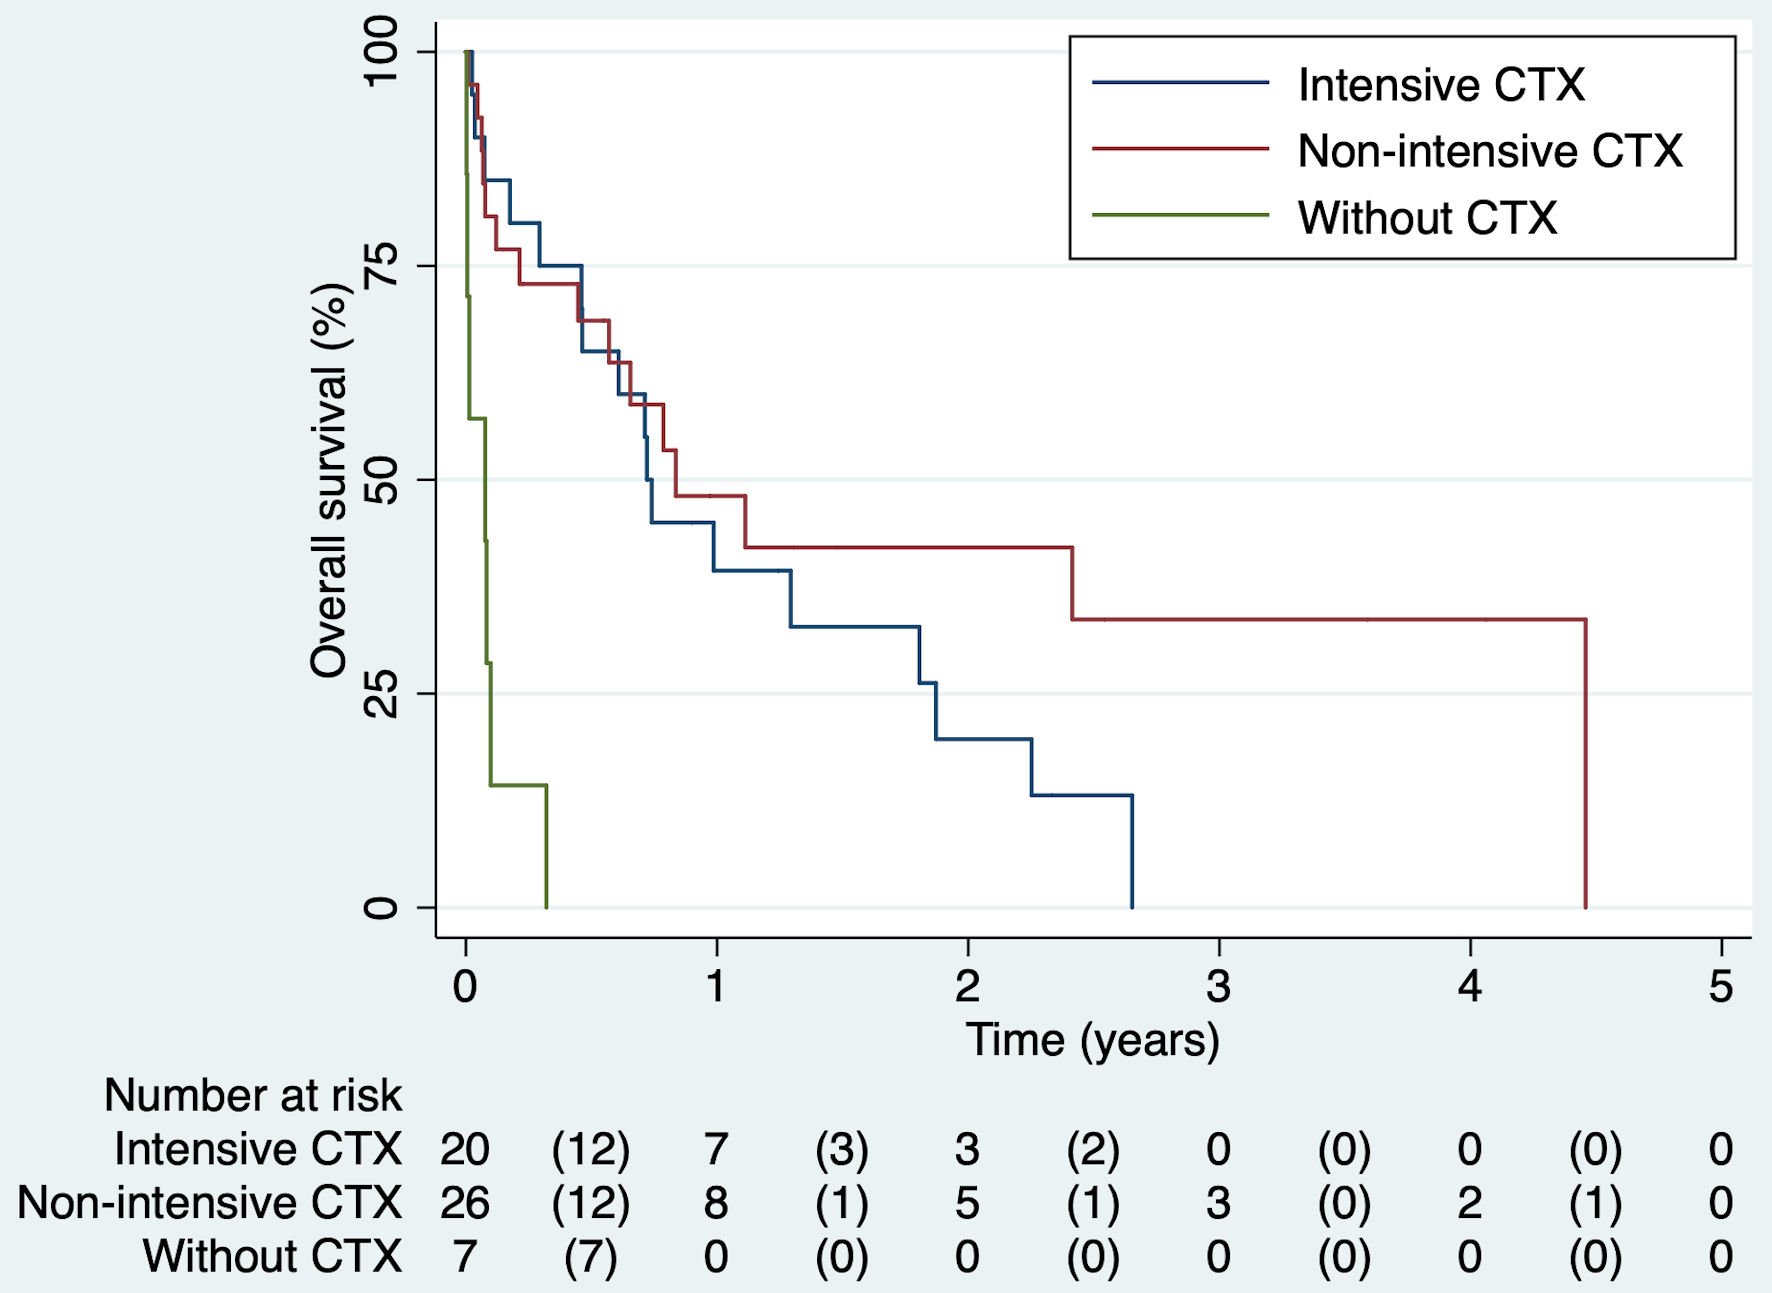
| Median overall survival (IQR), daysa | 266.5 (137.5 - 565.5) | 223.5 (54 - 477) | 0.658 | 28 (2 - 36) | 0.001 |
| Probability of survival, %a | |||||
| 30 days | 78.6 | 75.4 | 0.938 | < 1 | 0.006 |
| First year | 25.0 | 38.6 | - | ||
| Second year | 8.6 | 32.4 | - | ||
| Third year | - | 24.2 | - | ||