Figures
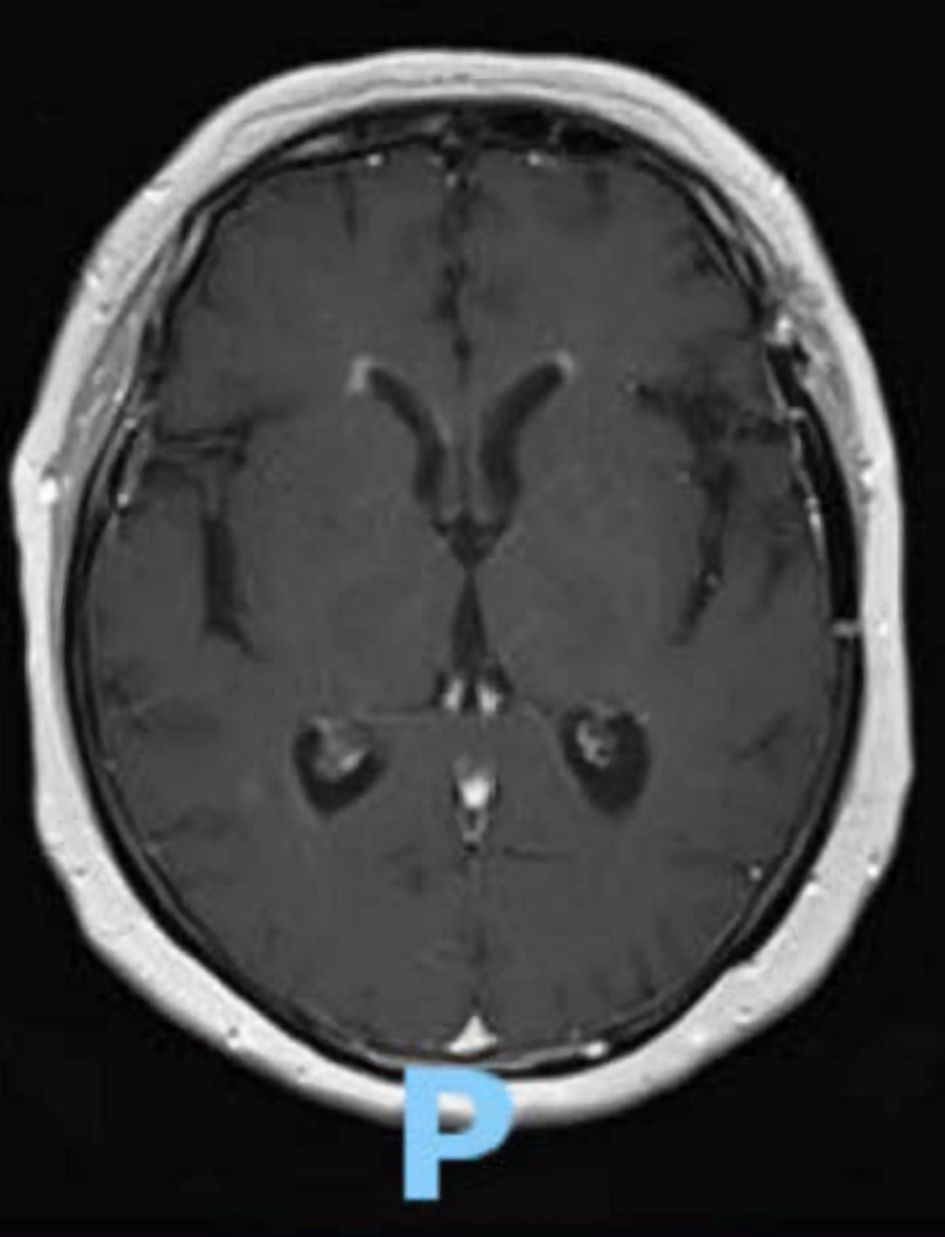
Figure 1. T1 weighted MRI of the head, axial view. This scan exhibits bilateral ependymal brain enhancement of the frontal horns, suggestive of ventriculitis, an uncommon imaging finding in mature T-lymphoblastic lymphoma/leukemia. MRI: magnetic resonance imaging.
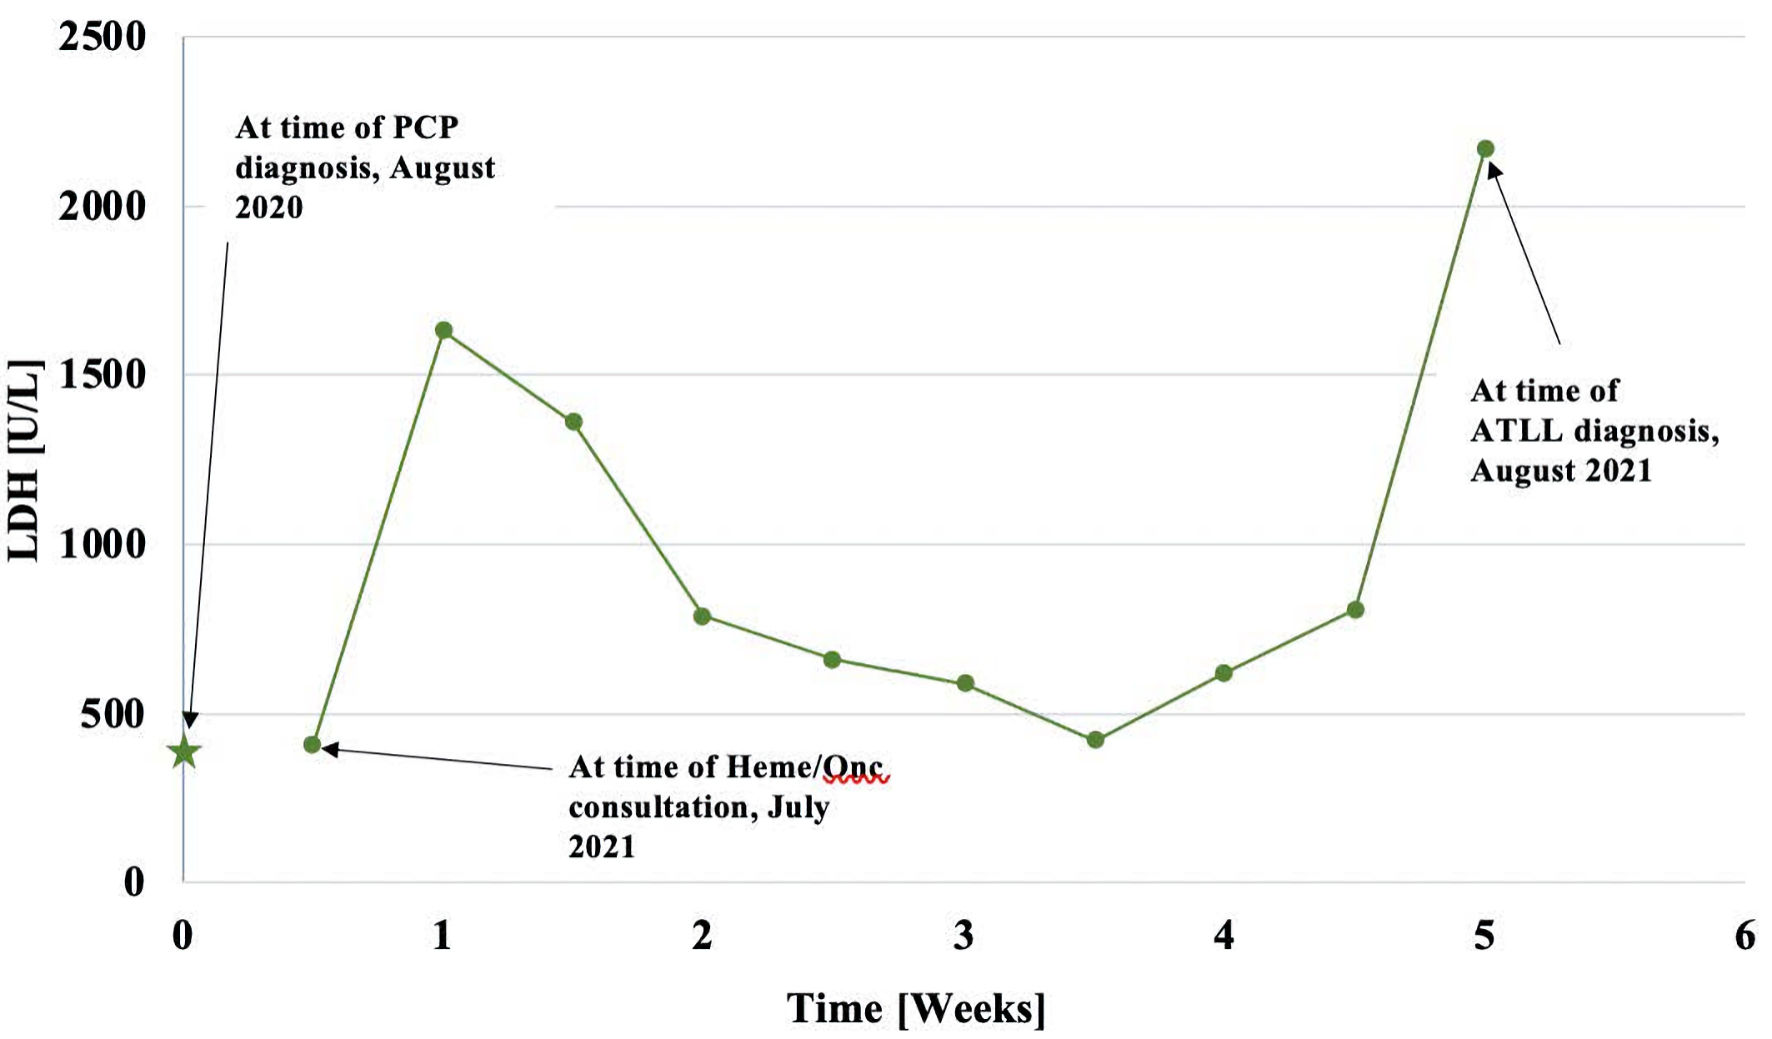
Figure 2. This graph represents the patient’s LDH values over time. The star represents the initial LDH (1 year prior) while point 1 represents LDH upon initial hematology consultation. The rest of the points represent the progression of LDH through the disease course. LDH: lactate dehydrogenase; PCP: Pneumocystis carinii pneumonia; ATLL: adult T-cell leukemia/lymphoma; Heme/Onc: hematology and oncology.
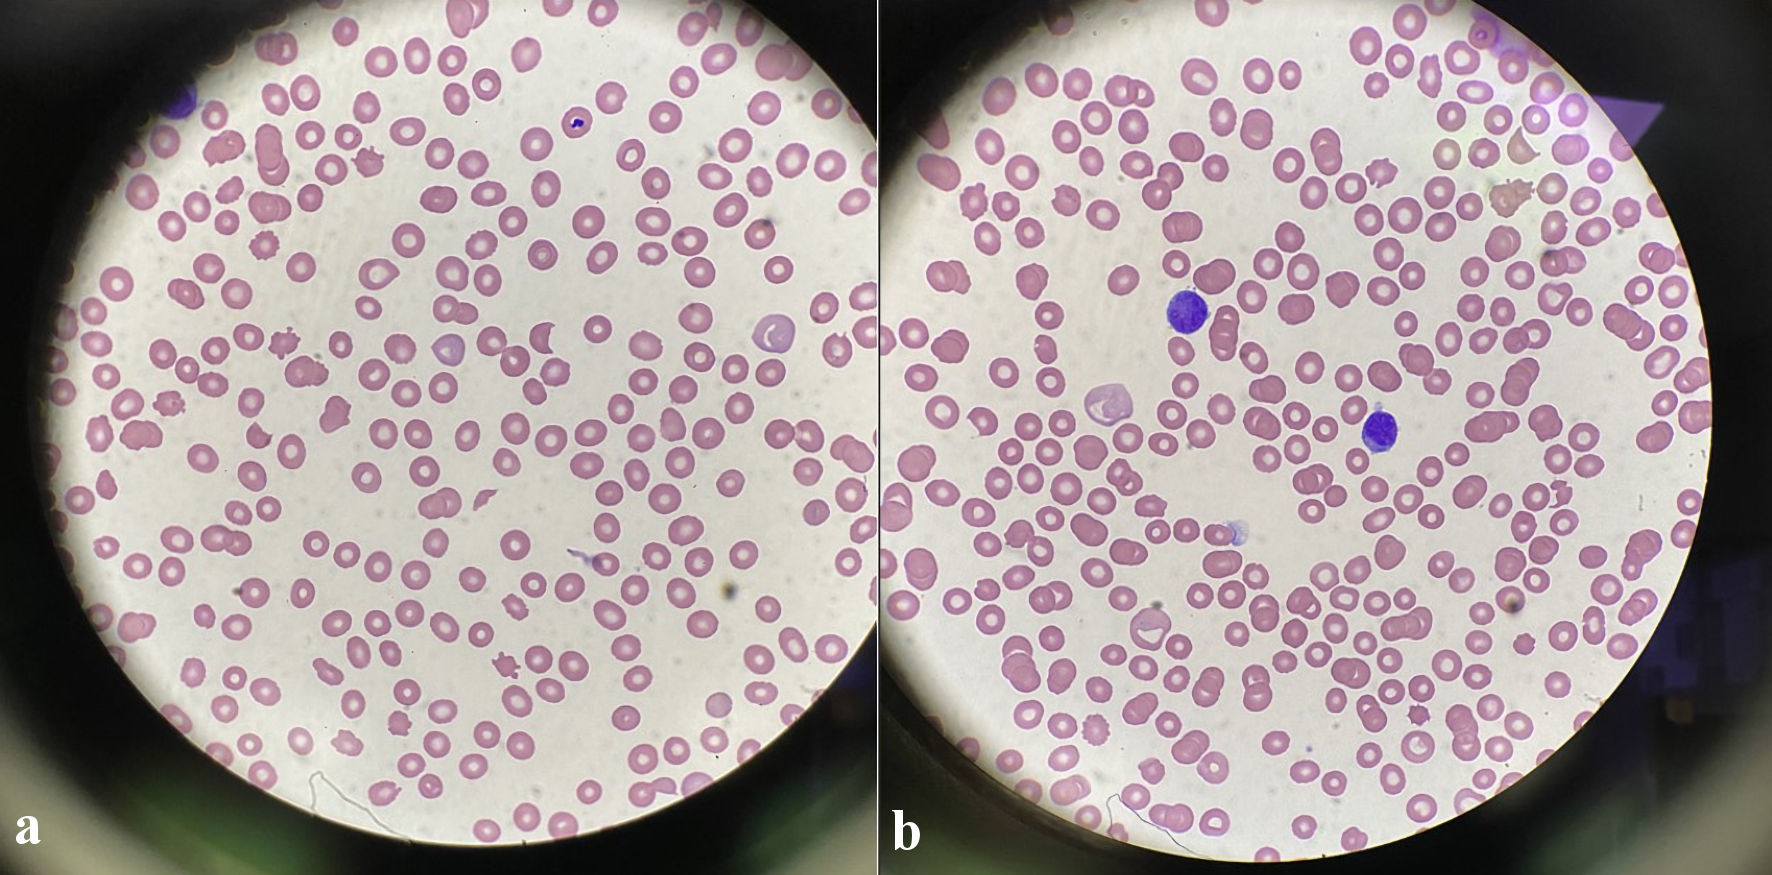
Figure 3. (a) Peripheral blood smear shows the presence of schistocytes, helmet cells (× 100, magnification). (b) Peripheral blood smear shows lymphocytic appearing cells with large irregular nuclei, similar to the appearance of the atypical cells in the CSF sample. CSF: cerebrospinal fluid.
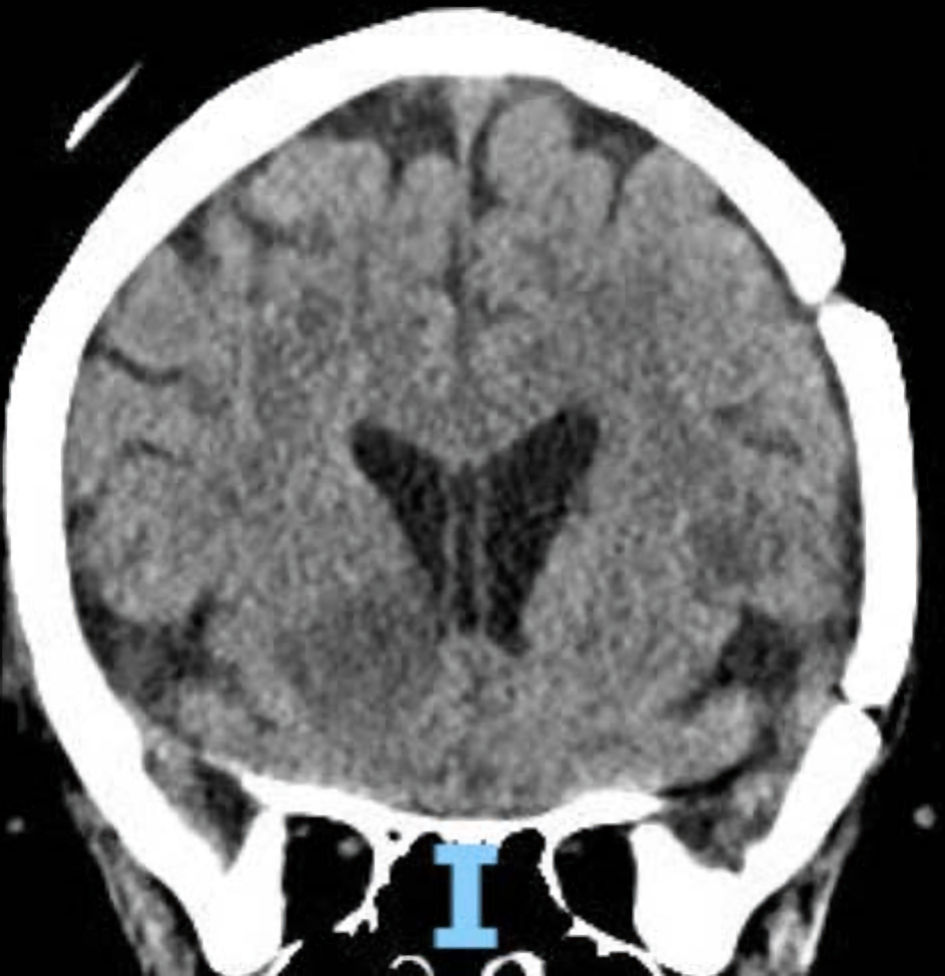
Figure 4. CT scan of the head, sagittal view. There is hypodensity of the right lentiform nucleus, most consistent with acute vascular pathology vs. inflammatory changes, an uncommon imaging finding in mature T-ALL. Solid masses are more characteristic of mature-T-ALL. CT: computed tomography; T-ALL: T-lymphoblastic leukemia.
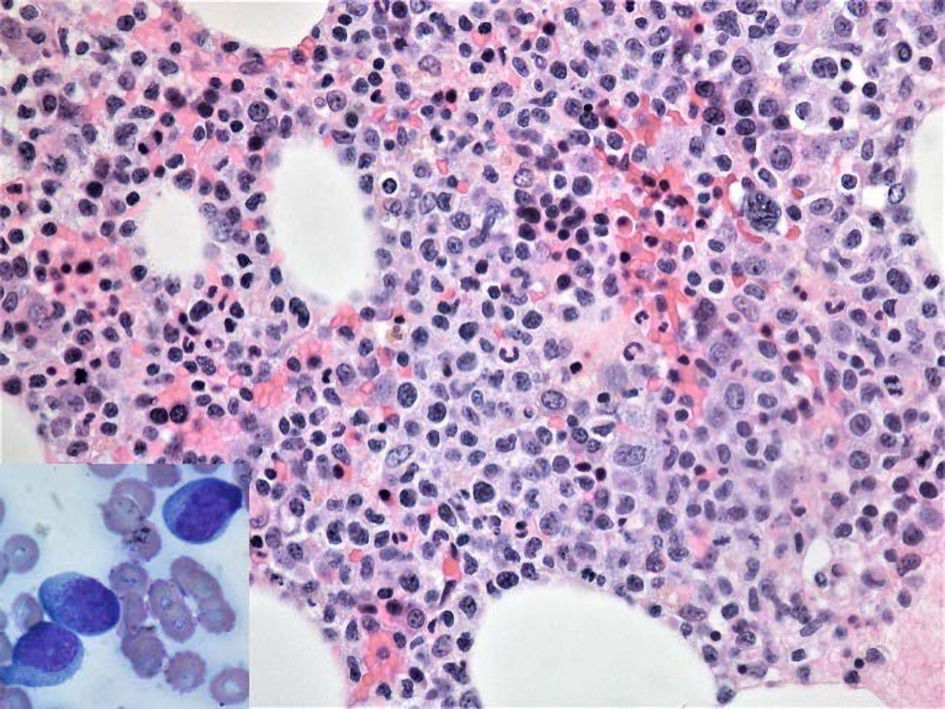
Figure 5. Hematoxylin and eosin stain reveals hypercellular bone marrow with extensive immature infiltrate in a background of decreased trilineage hematopoiesis (× 400, magnification). Bone marrow aspirate smear (inset) shows presence of lymphoblasts (medium-sized to large cells with higher nuclear to cytoplasm ratio, round to oval-shaped nucleus with fine chromatin and small nucleoli (× 1,000, magnification).
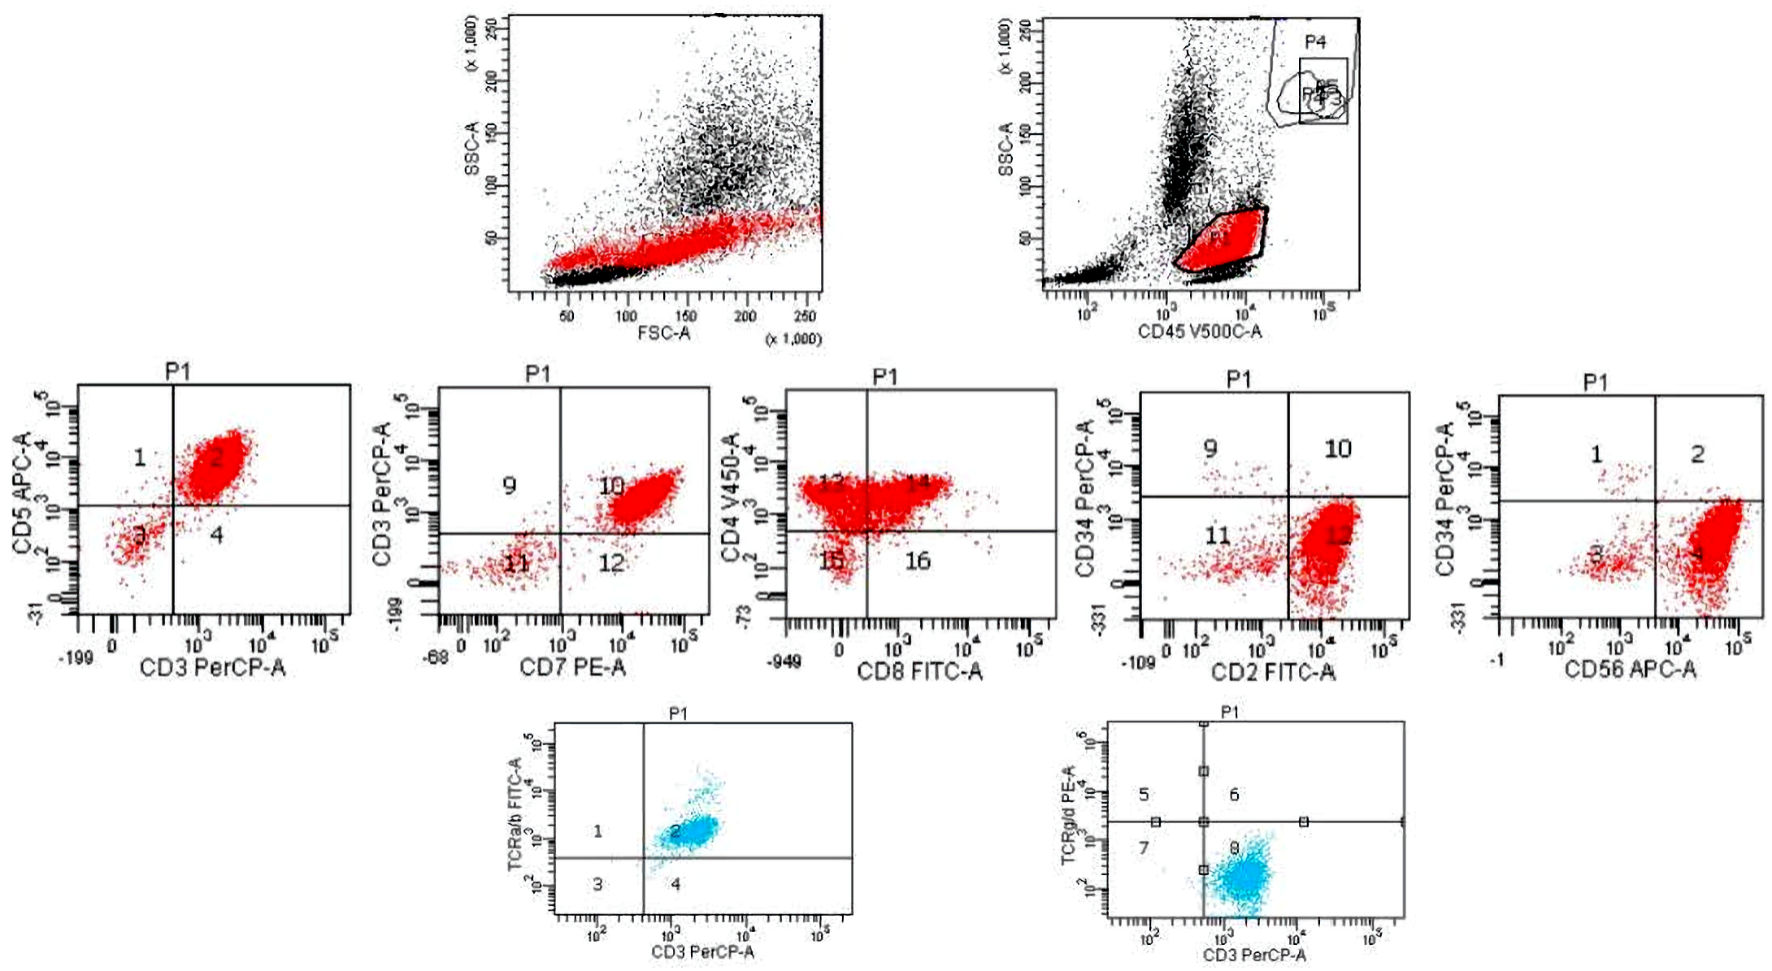
Figure 6. Flow cytometry histograms of the patient’s bone marrow sample. The blasts have a higher sight scatter (SSC) and forward scatter (FSC) and express CD2, CD3, CD4, CD5, CD7, CD8 (partial), CD56, negative to very dim TCR-alpha/beta (much weaker than the residual normal T cells), and negative for CD34, TCR-gamma/delta. TCR: T-cell receptor.
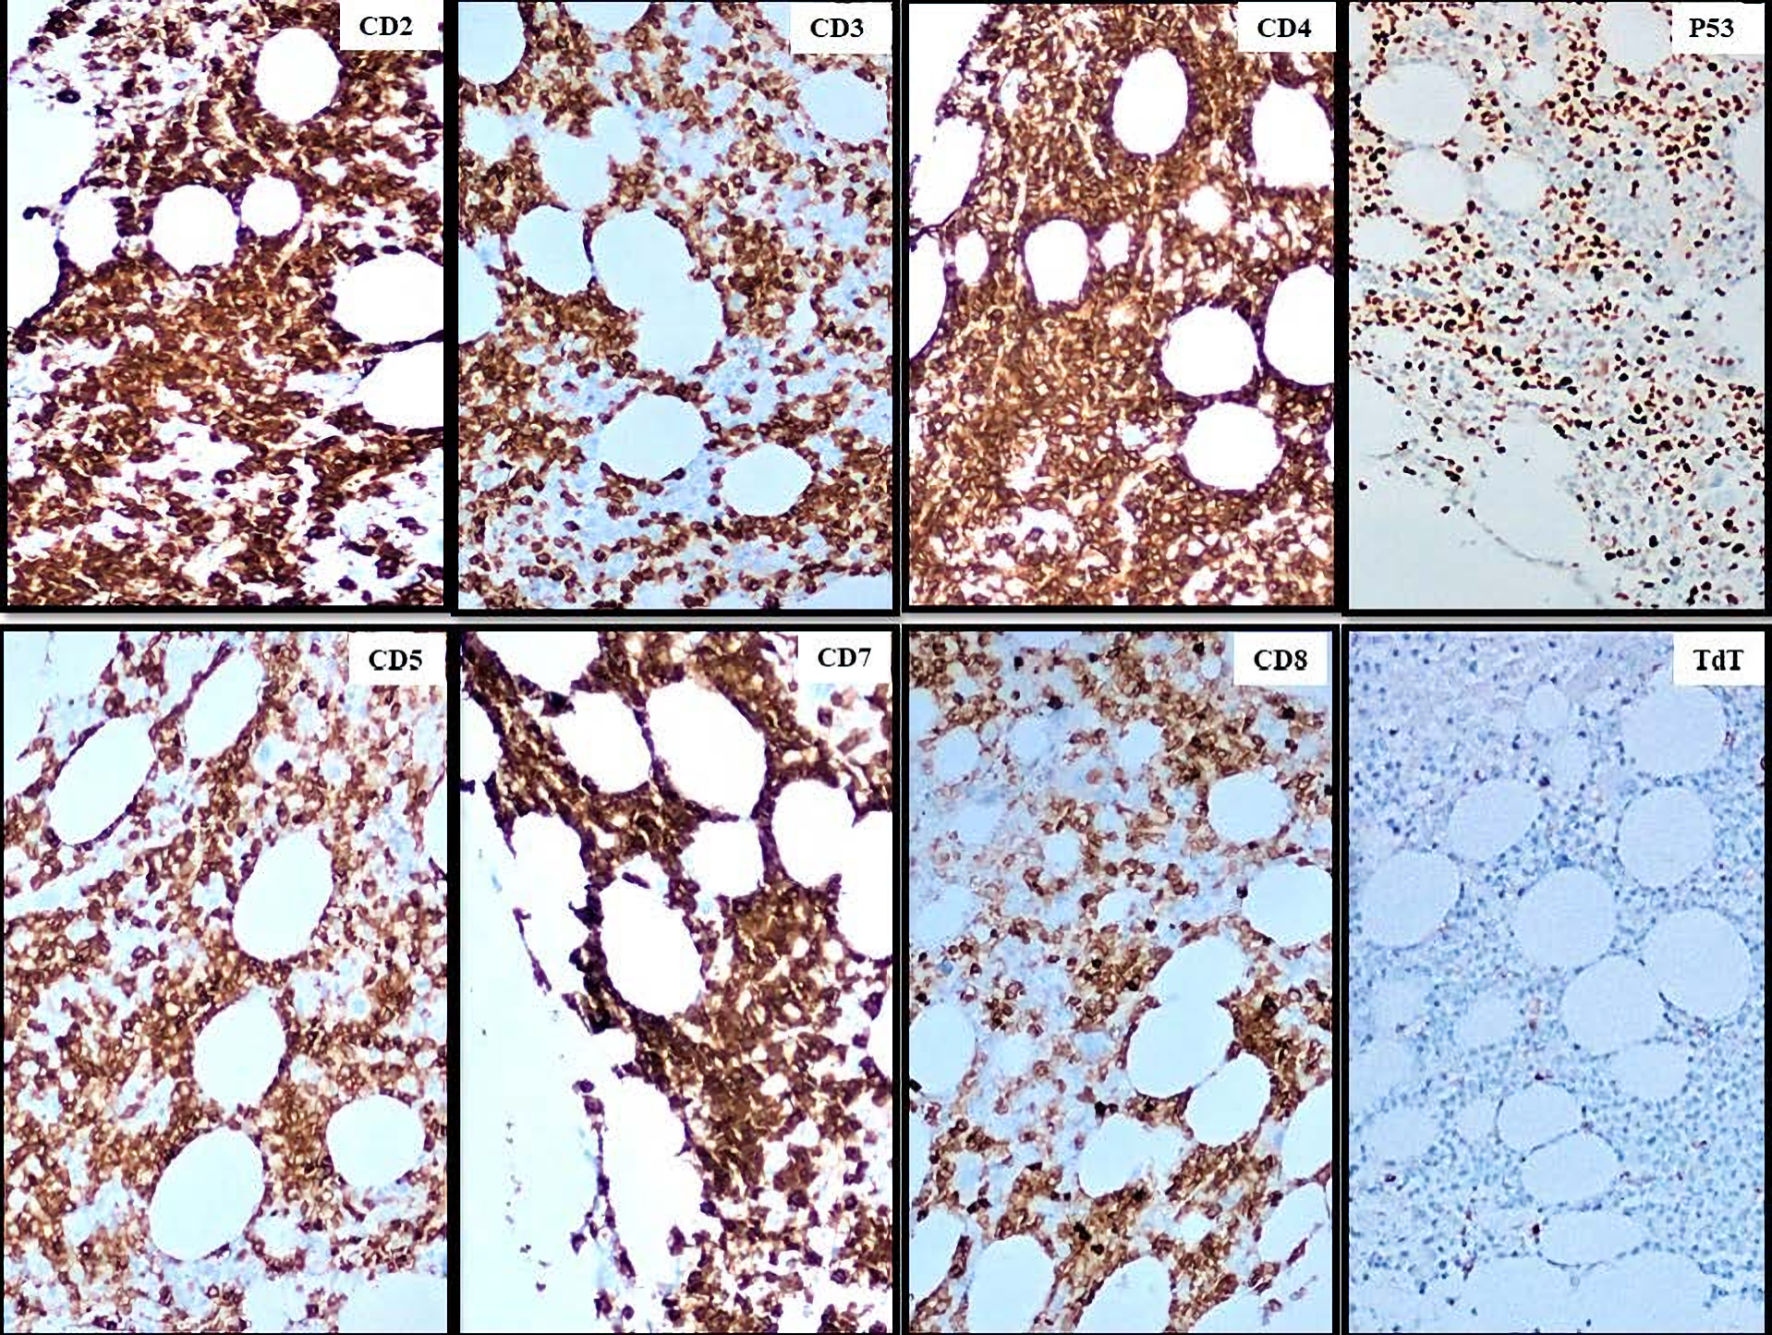
Figure 7. Immunohistochemistry of the patient’s bone marrow sample, displaying the staining patterns of each of the cell markers denoted in the top right corner. The blasts are positive for CD2, CD3, CD4, CD5, CD7, CD8 (partial), p53 and negative for TdT (× 100, magnification). TdT: terminal deoxynucleotidyl transferase.