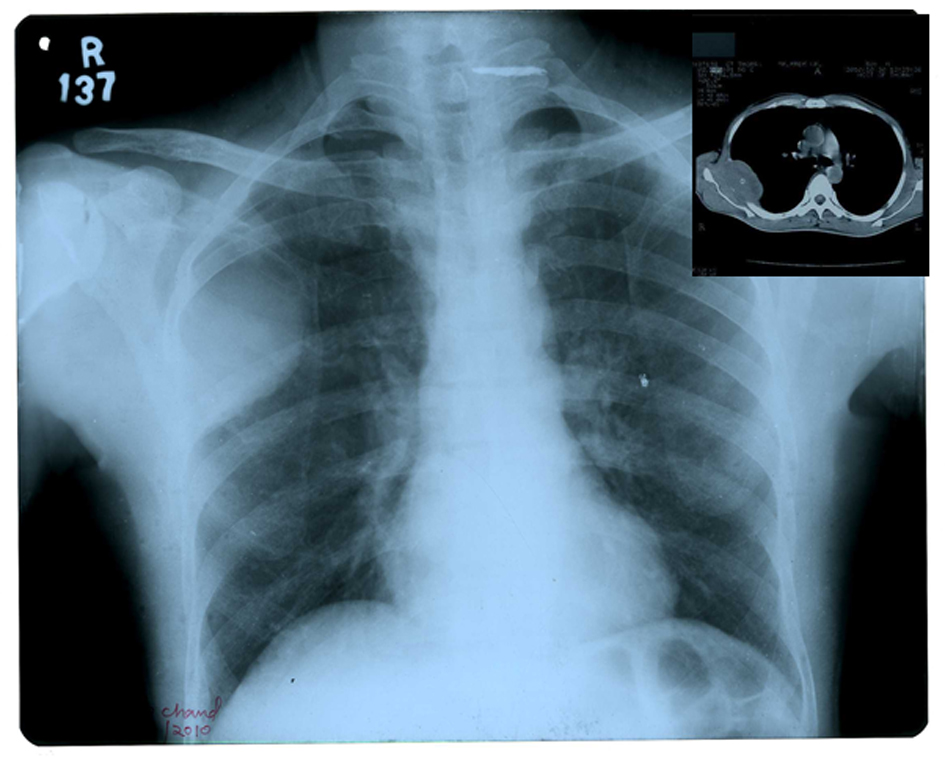
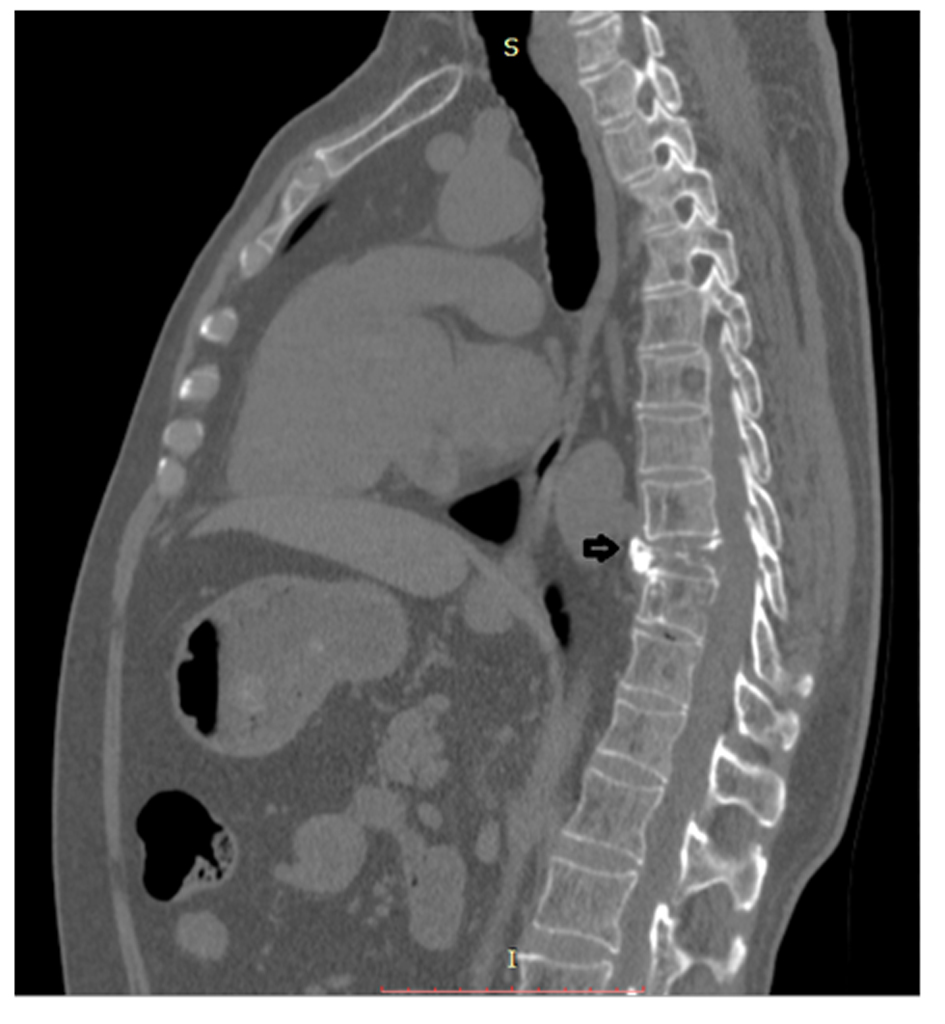
Figure 1. X-ray chest PA view showing a homogenous opacity in right middle lobe. Inset CT scan showing mass in right lung extending in thoracic cage.
| Journal of Hematology, ISSN 1927-1212 print, 1927-1220 online, Open Access |
| Article copyright, the authors; Journal compilation copyright, J Hematol and Elmer Press Inc |
| Journal website http://www.thejh.org |
Case Report
Volume 2, Number 1, June 2013, pages 42-47
Unconventional Presentation of Multiple Myeloma: A Series of 4 Cases
Figures
Table
| Parameters | Normal range | Case 1 | Case 2 | Case 3 | Case 4 |
|---|---|---|---|---|---|
| Kappa: κ; Lambda: λ; Bence Jones protein: BJ; ESR: by Wintrobe’s. | |||||
| Haematological | |||||
| Hb (g/dL) | 13.5 - 15.5 | 9.6 | 10.2 | 7.0 | 10.2 |
| TLC (× 109/µL) | 4.0 - 11.0 | 9.8 | 8.5 | 10.5 | 6.7 |
| Platelet (× 109/µL) | 150 - 400 | 220 | 200 | 310 | 250 |
| ESR (mm in 1st hr) | 0 - 14 (M) 0 - 20 (F) | 60 | 50 | 10 | 18 |
| Blood Picture | Normocytic normochromic | Normocytic normochromic | Microcytic hypochromic | Normocytic normochromic | |
| Bone marrow (% plasma cells) | 0.1 - 3.5 | 10 | 60 | 38 | 80 |
| Biochemical | |||||
| Urea (mg/dL) | 10 - 50 | 35 | 42 | 103 | 38 |
| Creatinine (mg/dL) | 0.7 - 1.3 | 0.8 | 0.9 | 15 | 1.0 |
| Total protein (g/dL) | 6.0 - 8.3 | 7.8 | 7.0 | 7.8 | 6.8 |
| Albumin (g/dL) | 3.5 - 5.7 | 4.2 | 4.0 | 3.4 | 3.8 |
| Calcium (mg/dL) | 8.5 - 10.5 | 10.0 | 10.2 | 9.8 | 9.6 |
| IgG (g/dL) | 6.94 - 16.2 | 17.1 | 12.2 | 20.1 | 13.1 |
| IgA (g/dL) | 0.80 - 4.00 | 2.38 | 2.52 | 1.52 | 2.18 |
| IgM (g/dL) | 0.50 - 2.00 | 0.82 | 1.22 | 0.92 | 0.62 |
| κ:λ ratio | 0.26 - 1.65 | 2.42 | 0.8 | 2.54 | 1.45 |
| Urine total protein (mg/24 hours) | 150 | No BJ | 3000, M protein κ | 2400 | No BJ |
| Amyloid | Negative | Positive | Positive | Negative | |
| Monoclonal band | M band, IgG κ in serum | M band in urine, free κ light chain | M band IgG κ in serum and urine | No M band in urine/serum | |