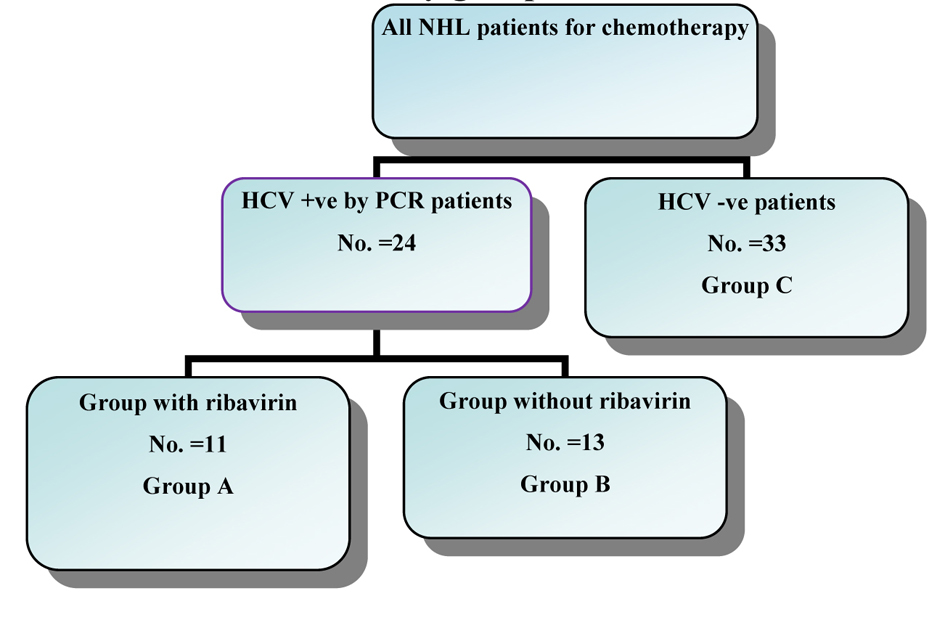
Figure 1. The distribution of the study groups.
| Journal of Hematology, ISSN 1927-1212 print, 1927-1220 online, Open Access |
| Article copyright, the authors; Journal compilation copyright, J Hematol and Elmer Press Inc |
| Journal website http://www.thejh.org |
Original Article
Volume 2, Number 1, June 2013, pages 14-21
Efficacy of Ribavirin to Prevent Hepatitis Reactivation in Hepatitis C Virus-Infected Patients Treated for Non-Hodgkin Lymphoma, Single Egyptian Center Study
Figures
Tables
| Variable | HCV +ve patients | HCV-ve patients Group C (33) No (%) | P-value | ||
|---|---|---|---|---|---|
| Received Ribavirin Group A (11) No (%) | Without Ribavirin Group B (13) No (%) | ||||
| LN: Lymphadenopathy; DLBCL: diffuse large B-cell lymphoma; IPI: International Prognostic Index. | |||||
| Age (years) | Mean ± SD | 45 ± 15.9 | 52 ± 6.5 | 49 ± 13.7 | 0.496 |
| Sex | Male | 6 (54.5%) | 5 (38.5%) | 19 (57.7%) | 0.50 |
| Female | 5 (45.5%) | 8 (61.5%) | 14 (42.4%) | ||
| PS | PS = 0.1 | 10(90.9% ) | 11(84.6% ) | 29 (87.9% ) | 0.895 |
| PS = 2 | 1 (9.1% ) | 2 (15.4% ) | 4 (12.1% ) | ||
| Clinical | LN(only) | 7 (63.6%) | 6 (46.2%) | 20 (60.6%) | 0.424 |
| Splenomegaly | 3 (27.3%) | 5 (38.5%) | 5 (15.2%) | ||
| Extranodal | 1 (9.1%) | 2 (15.4%) | 8 (24.2%) | ||
| Stage | I | 0 (0 %) | 1 (7.7%) | 4 (12.1%) | 0.224 |
| II | 2 (18.2%) | 3 (23.1%) | 15 (45.5%) | ||
| III | 4 (36.4%) | 6 (46.2%) | 9 (27.3%) | ||
| IV | 5 (45.5%) | 3 (23.1%) | 5 (15.2%) | ||
| LDH | Normal | 0 (0 %) | 0 (0 %) | 2 (6.1 %) | 0.471 |
| High (234) | 11 (100%) | 13 (100%) | 31 (90.9%) | ||
| IPI | Low risk | 1 (9.1%) | 3 (23.1%) | 11 (33.3%) | 0.572 |
| Low-intermediate risk | 8 (72.7%) | 8 (61.5%) | 18 (54.5%) | ||
| High intermediate risk | 2 (18.2%) | 2 (15.4%) | 3 (9.1%) | ||
| High risk | 0 (0 %) | 0 (0 %) | 1 (3.0%) | ||
| Pathology | DLBCL | 8 (72.7%) | 7 (53.8%) | 24 (72.7%) | 0.130 |
| Indolent NHL | 3 (27.3%) | 6 (46.2%) | 5 (15.2%) | ||
| - marginal zone lymphoma | 1 (9%) | 2 (15.3%) | 0 (0%) | ||
| - small lymphocytic lymphoma | 0 (0%) | 3 (23%) | 4 (12.1%) | ||
| - Mantle cell lymphoma | 1 (9%) | 1 (7.6%) | 1 (3%) | ||
| - Lymphoplasmacytic lymphoma | 1 (9%) | 0 (0%) | 0 (0%) | ||
| Burkitt | 0 (0%) | 0 (0%) | 4 (12.1%) | ||
| Chemotherapy | CHOP | 8 (72.7%) | 7 (53.8%) | 24 (72.7%) | 0.165 |
| -COP | 3 (27.3%) | 5 (38.5%) | 5 (15.2%)) | ||
| -Hyper CVAD | 0 (0%) | 0(0 %) | 4 (12.1%) | ||
| -FC | 0 (0%) | 1 (7.7%) | 0 (0%) | ||
| Variable | HCV + ve patients | P value | |
|---|---|---|---|
| Received Ribavirin (11) No (%) | Without Ribavirin (13) No (%) | ||
| Enzyme flare: | 0.605 | ||
| No | 8, 72.7 | 9, 69.2 | |
| Yes | 3, 27.3 | 4, 30.8 | |
| PCR reactivation: | 0.585 | ||
| No | 9, 81.8 | 10, 76.9 | |
| Yes | 2, 18.2 | 3, 23.1 | |
| Variable | Hepatic enzyme flare | P value | |
|---|---|---|---|
| No enzyme flare (49) No (%) | With enzyme flare (8) No (%) | ||
| Chemotherapy course: | 0.002* | ||
| -completed | 49, 100 | 5, 62.5 | |
| -stopped | 0, 0 | 3, 37.5 | |
| Variable | HCV + ve NHL patients | P value | |
|---|---|---|---|
| No HCV PCR reactivation No (19) % | With HCV PCR reactivation No (5) % | ||
| Enzyme flare: | < 0.001* | ||
| No | 17, 89.5 | 0, 0 | |
| Yes | 2, 10.5 | 5, 100 | |
| Response | HCV + ve patients | HCV-ve patients Group C (33) No (%) | P value | |
|---|---|---|---|---|
| Received Ribavirin Group A (11) No (%) | Without Ribavirin Group B (13) No (%) | |||
| Responders | 0.329 | |||
| Complete | 8, 72.7 | 6, 46.2 | 22, 66.7 | |
| Non-responders | 3, 27.3 | 7, 53.8 | 11, 33.3 | |
| Partial | 3, 27.3 | 5, 38.5 | 8, 24.2 | |
| Stable | 0, 0.0 | 1, 7.7 | 3, 9.1 | |
| Progression | 0, 0.0 | 1, 7.7 | 0, 0.0 | |
| Total | 11, 100 | 13, 100 | 33, 100 | |