Journal of Hematology, ISSN 1927-1212 print, 1927-1220 online, Open Access
Article copyright, the authors; Journal compilation copyright, J Hematol and Elmer Press Inc
Journal website http://www.thejh.org

Original Article

Volume 2, Number 1, June 2013, pages 1-7


The Effect of Vitamin D3 on Hepcidin and IL-8 Expression in Monocytes

Figures

Figure 1.
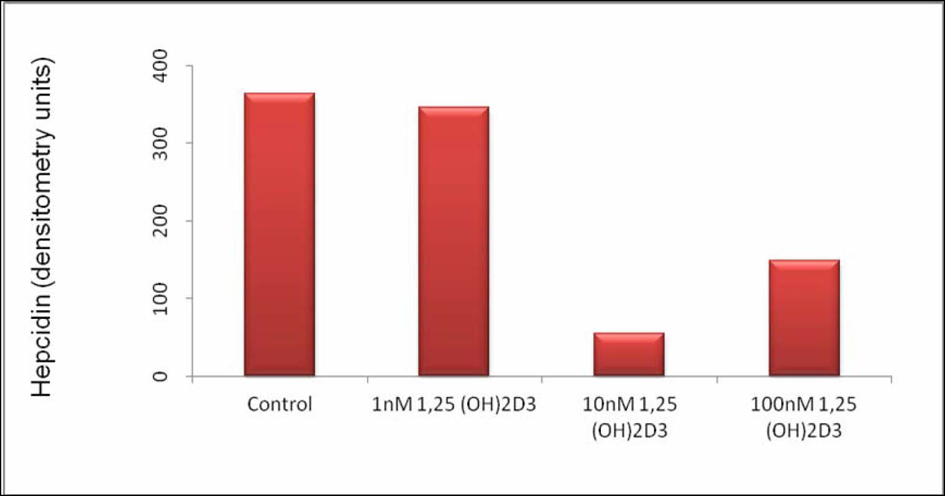
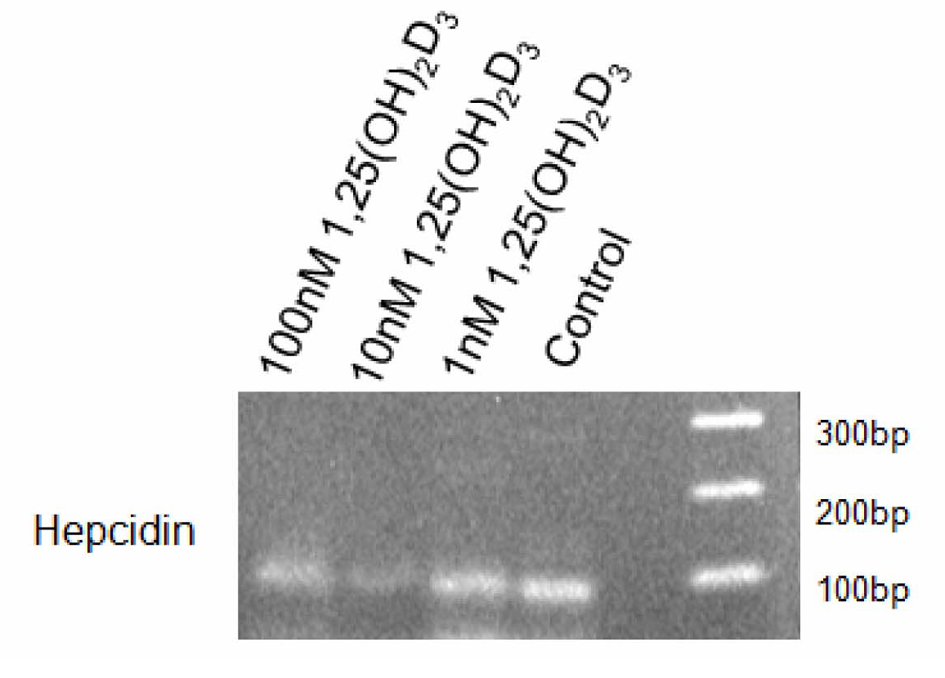
Figure 1. Hepcidin Expression in THP-1 Cells Treated With 1, 25 (OH)2D3. THP-1 cells (100,000 cells per well) were cultured in RPMI medium containing 5% FBS and stimulated with 1, 10 or 100 nM 1, 25 (OH)2D3 or diluent (control). After 4 hours, cells were collected, RNA isolated and hepcidin expression analysed by RT-PCR. Fragments were analysed by electrophoresis using a 2% agarose gel.
Figure 2.
Figure 2. Hepcidin Expression in THP-1 Cells Stimulated With 1, 25 (OH)2D3. Hepcidin expression in arbitrary units after gel densitometry of Figure 1.
Figure 3.
Figure 3. IL-8 Production by THP-1 Cells Stimulated in the Absence and Presence of 1, 25 (OH)2D3. THP-1 cells (100,000 cells per well) were cultured in RPMI medium containing 5% FBS) and stimulated with 1, 25 (OH)2D3 at 1, 10 and100 nM or diluent (control). After 4 and 20 hours, supernatants were collected and analysed for IL-8 content by ELISA.

Table

Table 1. Forward and Reverse Sequences of the Primers Used in the RT-PCR
 
GeneForward primerReverse primer
GAPDH5’-GGACCTGACCTGCCGTCTAG-3’5’-TAGCCCAGGATGCCCTTGAG-3’
HAMP5’-GACACCCACTTCCCCATCTG-3’5’-GCAGGGCAGGTAGGTTCTAC-3’