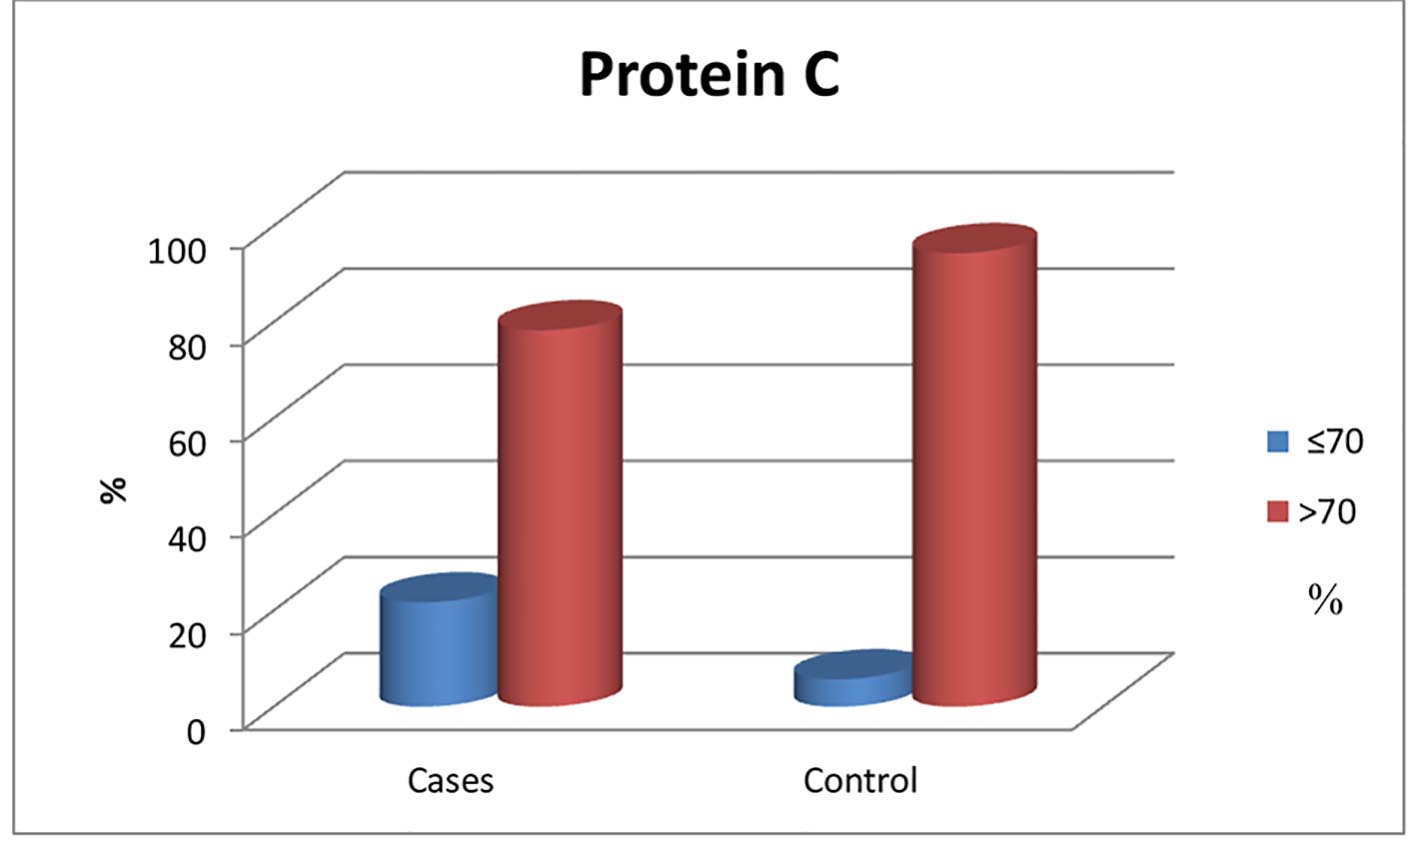
Figure 1. Normal and below normal protein C levels in patients and control group.
| Journal of Hematology, ISSN 1927-1212 print, 1927-1220 online, Open Access |
| Article copyright, the authors; Journal compilation copyright, J Hematol and Elmer Press Inc |
| Journal website http://www.thejh.org |
Original Article
Volume 7, Number 2, May 2018, pages 62-68
Protein C and Anti-Thrombin-III Deficiency in Children With Beta-Thalassemia
Figures
Tables
| Data | Patients (N = 60), no. (%) |
|---|---|
| Data are expressed as mean ± SD, median (min. - max). INR: international normalized ratio. | |
| Age | |
| Median (min. - max.) | 9.12 (2.50 - 17.00) |
| ≤ 10 years | 43 (71.7%) |
| > 10 years | 17 (28.3%) |
| Sex | |
| Male | 28 (46.7%) |
| Female | 32 (53.3%) |
| Type of β-thalassemia | |
| β-thalassemia major | 35 (58.3%) |
| β-thalassemia intermedia | 25 (41.7%) |
| Splenectomy | |
| Yes | 30 (50%) |
| No | 30 (50%) |
| Albumin, g/dL | 4.5 ± 0.41 |
| INR | 1.2 ± 0.22 |
| Sr. creatinine, mg/dL | 0.51 ± 0.15 |
| Sr. ferritin, ng/mL | 992 (134 - 9,267) |
| No. of patient, ferritin < 1,000 ng/mL | 32 |
| No. of patient, ferritin≥ 1,000 ng/mL | 28 |
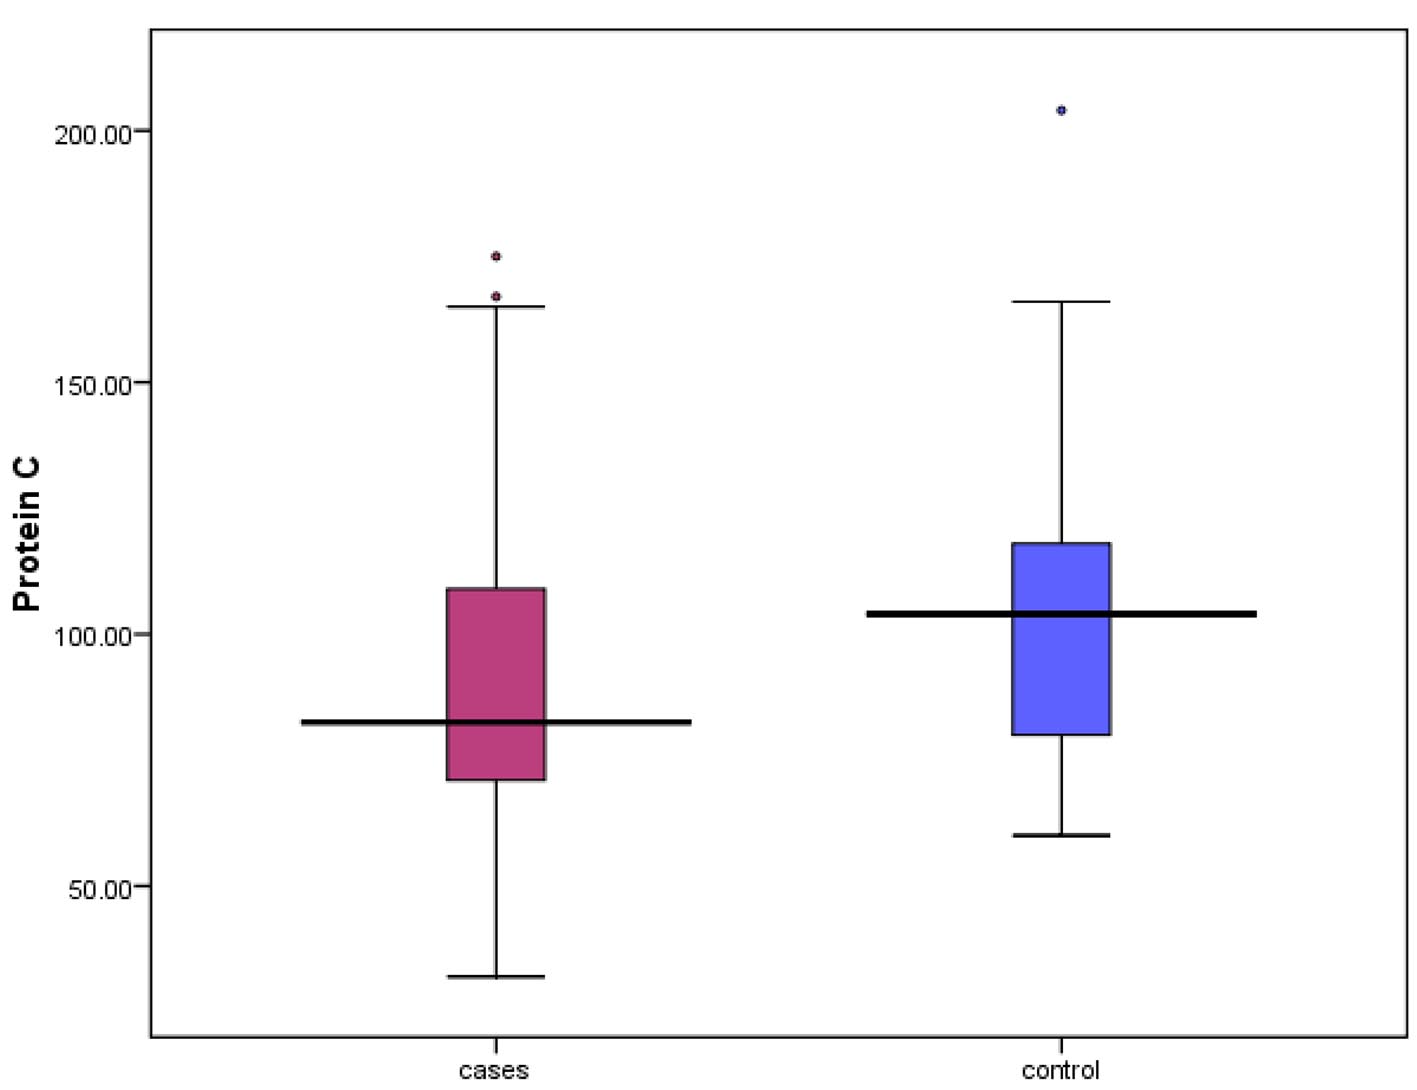
| Protein C, % | 82.50 (32 - 175) |
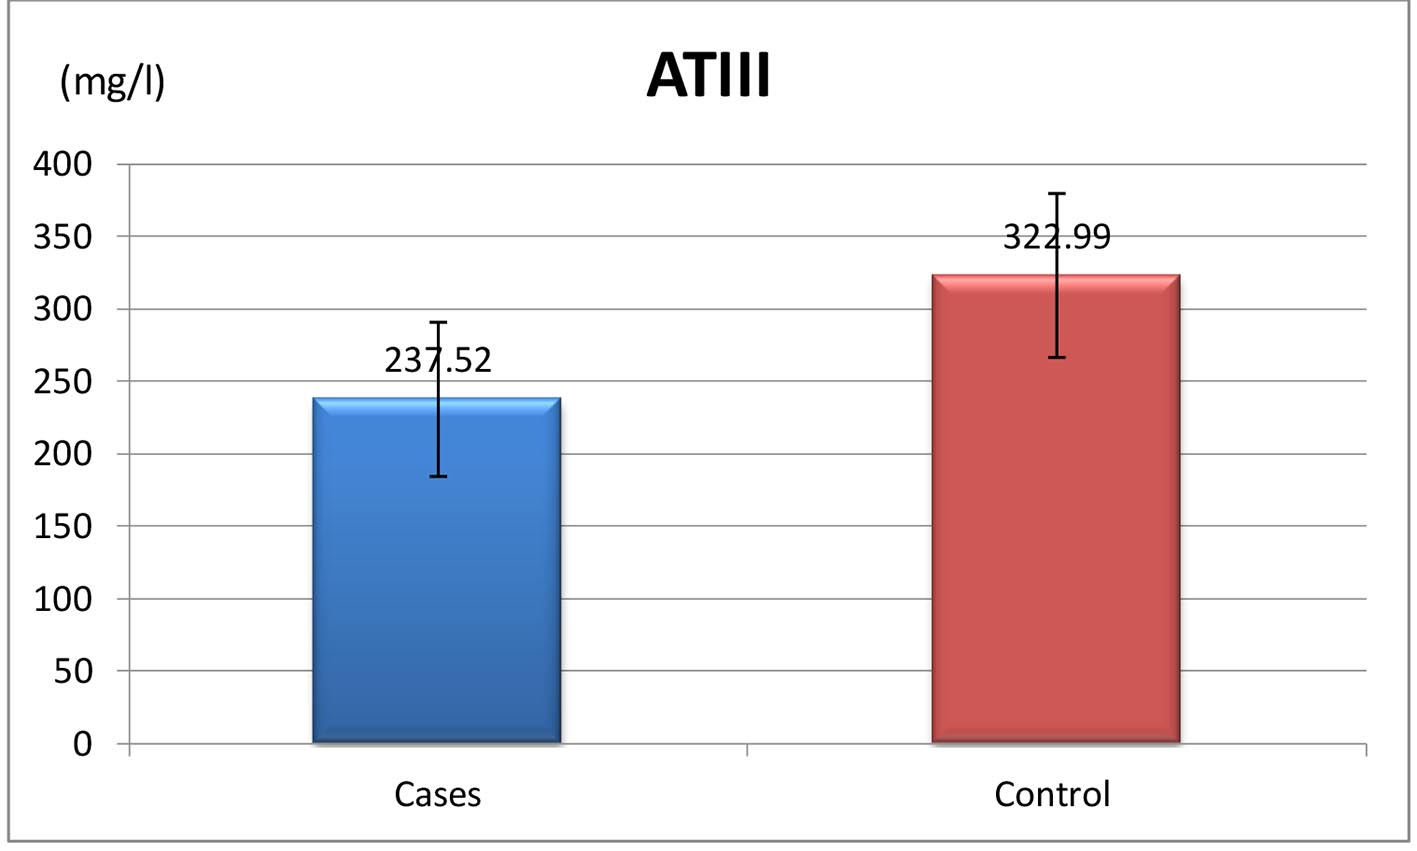
| Anti-thrombin III, mg/L | 237.52 ± 53.19 |
| Natural anticoagulant | Patients (N = 60) | Healthy children (N = 35) | P value |
|---|---|---|---|
| Data are expressed as mean ± SD, median (min. - max.) or number and %. *Means statistically significant. AT-III: anti-thrombin III. | |||
| Protein C | |||
| N (72-160%) | 82.50 (32 - 175) | 104 (60 - 204) | 0.041* |
| Low (≤ 72%) | 13 (21.7%) | 2 (5.7%) | 0.04* |
| Normal (> 72%) | 47 (78.3%) | 33 (94.3%) | |
| AT-III | |||
| N (200 - 400 mg/L) | 237.52 ± 53.19 | 322.99 ± 56.57 | ≤ 0.001* |
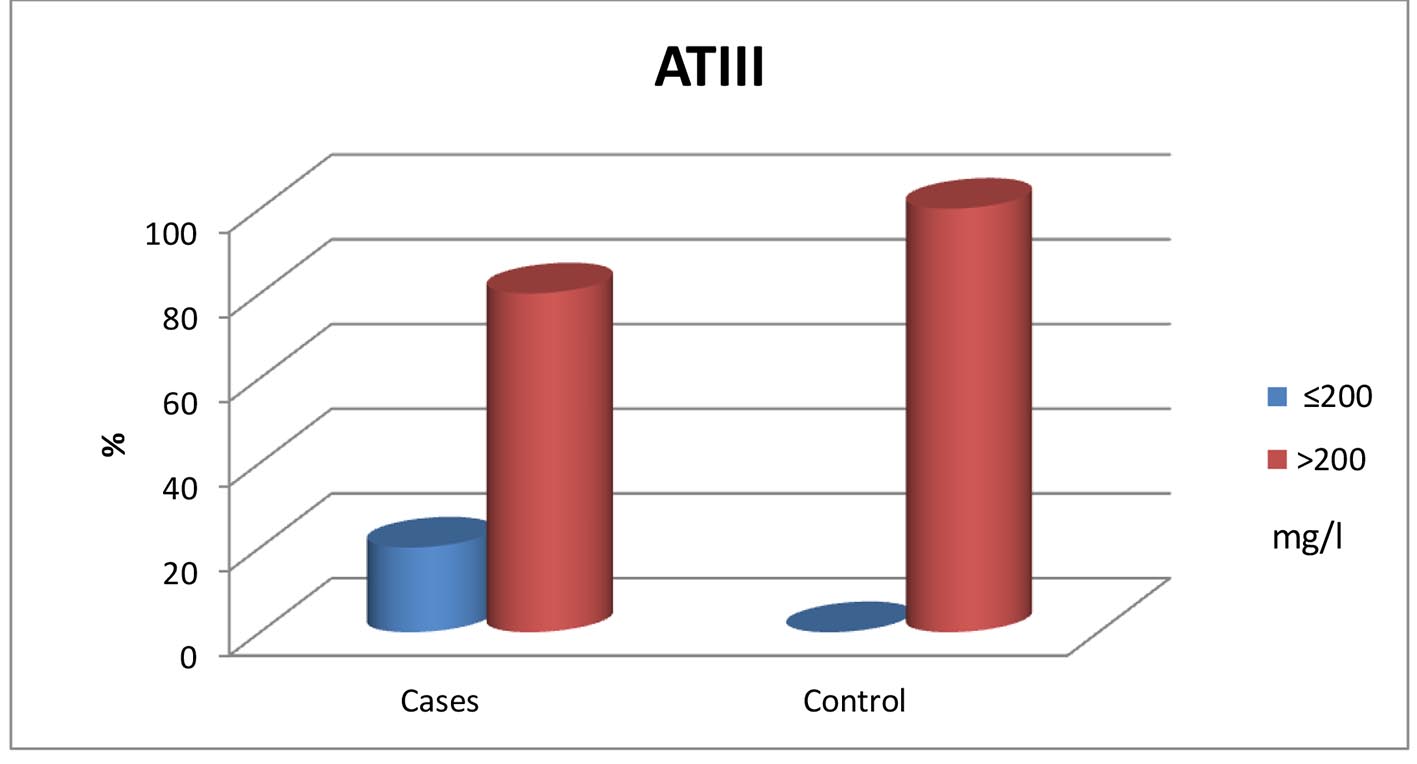
| Low (≤ 200 mg/L) | 12 (20.0%) | 0 (0%) | 0.005* |
| Normal (> 200 mg/L) | 48 (80.0%) | 35 (100%) | |
| Criteria | No. of patients | Protein C, % | P value | AT-III, mg/L | P value |
|---|---|---|---|---|---|
| *P value is significant. Data are expressed as median (min. - max.) and mean ± SD. | |||||
| Sex | 0.41 | 0.15 | |||
| Male | 28 | 86.5 (32 - 175) | 226.84 ± 58.92 | ||
| Female | 32 | 82 (36 - 132) | 246.24 ± 46.24 | ||
| Age | 0.02* | 0.64 | |||
| ≤ 10 years | 31 | 95(32 - 175) | 240.28 ± 46.48 | ||
| > 10 years | 29 | 75 (50 - 133) | 233.88 ± 59.82 | ||
| Thalassemia subtype | 0.59 | 0.21 | |||
| β-thalassemia major | 35 | 81 (32 - 167) | 229.97 ± 51.21 | ||
| β-thalassemia intermedia | 25 | 83 (36 - 175) | 247.30 ± 54.80 | ||
| Splenectomy | 0.011* | 0.04* | |||
| Yes | 30 | 75 (32 - 131) | 223.53 ± 61.09 | ||
| No | 30 | 97.5 (36 - 175) | 250.84 ± 39.93 | ||
| Ferritin (ng/mL) | 0.78 | 0.56 | |||
| < 1,000 | 32 | 90.5 (32 - 175) | 240.95 ± 47.32 | ||
| ≥ 1,000 | 28 | 77 (36 - 165) | 232.89 ± 59.39 | ||
| Laboratory criteria | Protein C | AT-III | ||
|---|---|---|---|---|
| r | P | r | P | |
| Pearson correlation was used to correlate parametric data, while Spearman correlation was used to correlate non-parametric data. *P value is significant. | ||||
| Age/years | -0.352 | 0.006* | -0.274 | 0.034* |
| Duration/years | -0.399 | 0.002* | -0.376 | 0.003* |
| SGOT, U/L | -0.164 | 0.211 | -0.429 | 0.001* |
| SGPT, U/L | -0.264 | 0.041* | -0.385 | 0.002* |
| Albumin, g/dL | 0.278 | 0.032* | 0.355 | 0.005* |
| STB, mg/dL | -0.275 | 0.033* | -0.221 | 0.089 |
| SDB, mg/dL | -0.239 | 0.066 | -0.313 | 0.015* |
| INR | -0.272 | 0.036* | -0.420 | 0.001* |
| Ferritin, ng/mL | -0.168 | 0.801 | -0.141 | 0.281 |