Journal of Hematology, ISSN 1927-1212 print, 1927-1220 online, Open Access
Article copyright, the authors; Journal compilation copyright, J Hematol and Elmer Press Inc
Journal website http://www.thejh.org

Original Article

Volume 6, Number 4, October 2017, pages 81-86


Regulatory and Memory B Lymphocytes in Children With Newly Diagnosed Immune Thrombocytopenia

Figure

Figure 1.
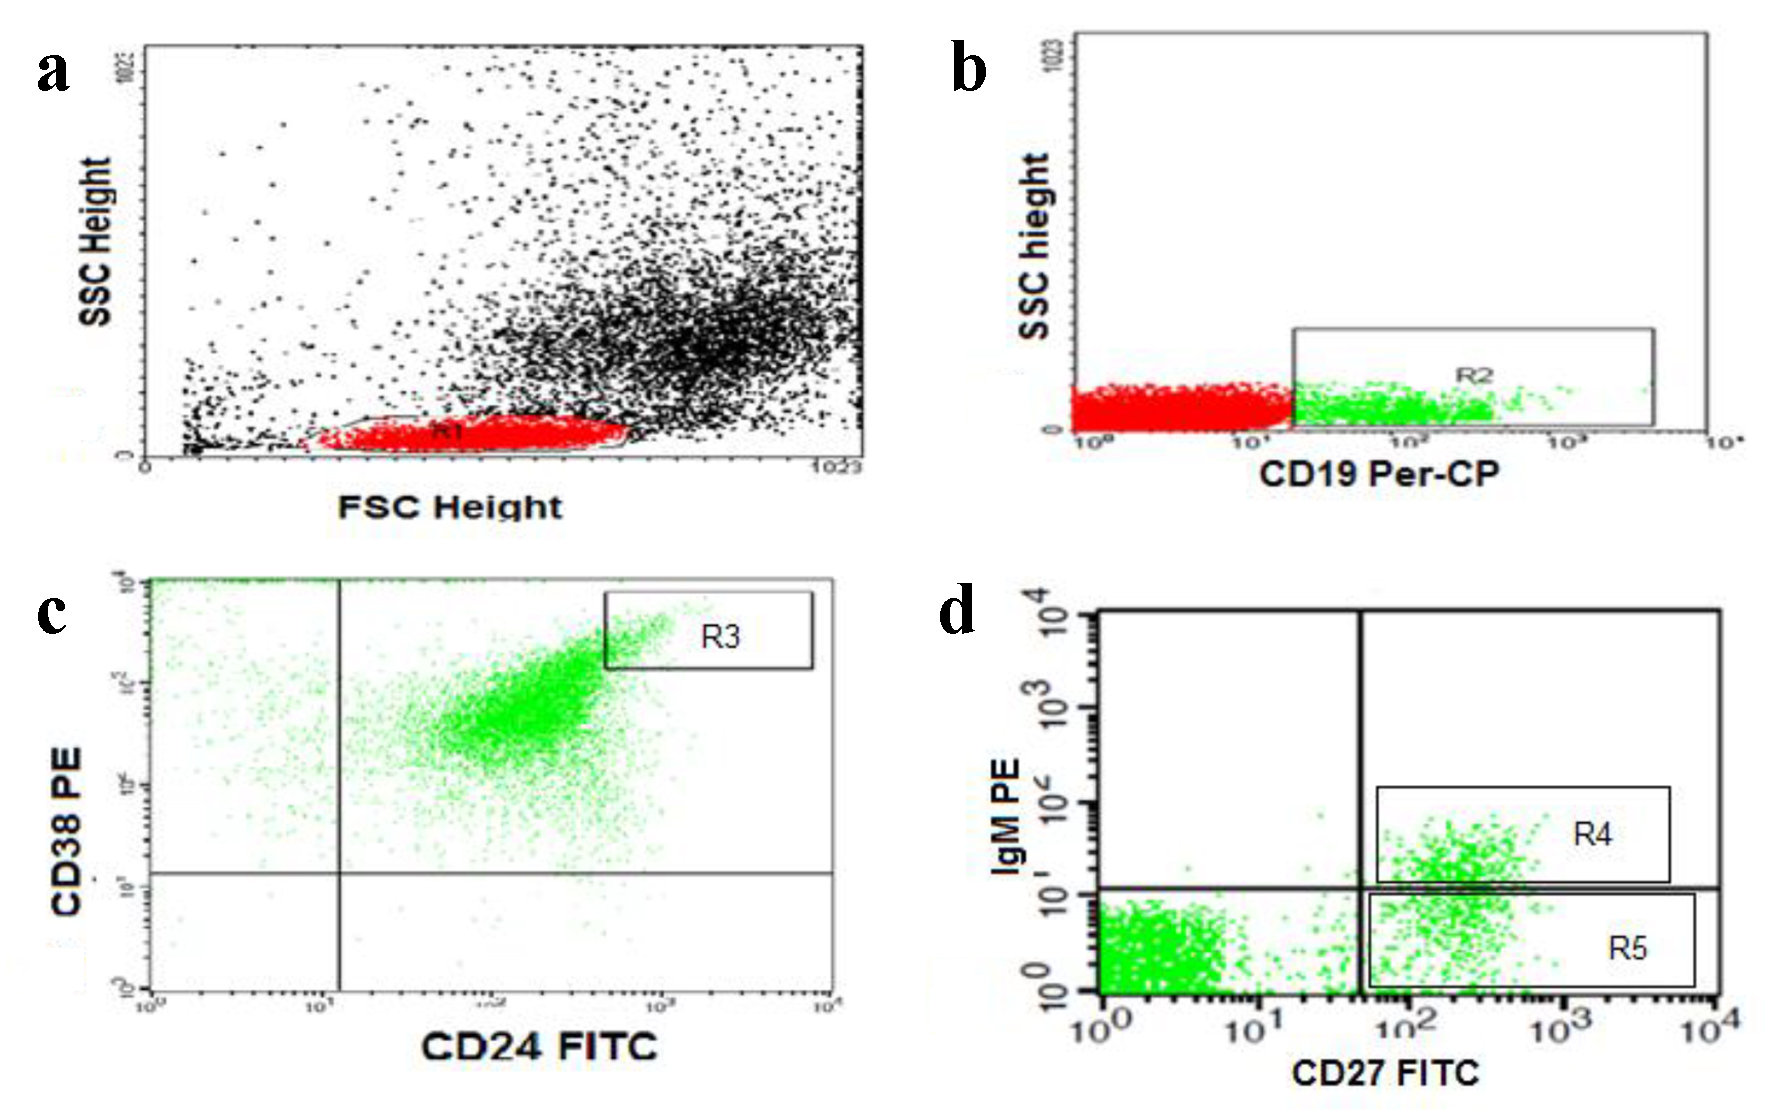
Figure 1. Flow cytometric detection of regulatory and memory B cells. (a) Forward and side scatter histogram was used to define the lymphocytes population (R1). (b) The CD19+ cells (B lymphocytes, R2) were then gated for further analysis. (c) The expression of CD24 and CD38 was assessed in CD19+ B cells to define CD19+CD24+HighCD38+High cells (regulatory B cells, R3). (d) The expression of IgM and CD27 in was assessed in CD19+ B cells to detect the CD19+CD27+IgM+ (IgM memory B cells, R4) and CD19+CD27+IgM- (switched memory B cells, R5).

Tables

Table 1. Baseline Characteristics of ITP Patients and Controls
 
Patients (n = 30)Controls (n = 20)P-value
Data represented as mean ± SEM. P ≤ 0.05 is significant. MPV: mean platelet volume; WBCs: white blood cells.
Age (years)5.95 ± 0.716.14 ± 0.940.55
Sex (male/female)17/1311/9-
Petechial rash30/30 (100 %)--
Bruising30/30 (100%)--
Epistaxis (mild)8/30 (26.6%)--
Preceding febrile illness20/30 (67.7%)--
Splenomegaly0/30--
Hepatomegaly0/30--
Platelet count (× 109/L)12 ± 0.78248.55 ± 19.410.000
WBCs count (× 109/L)7.99 ± 0.409.12 ± 0.630.18
Hemoglobin (g/dL)10.81± 0.2011.40 ± 0.220.06
MPV (Femtoliter)9.32 ± 0.255.29 ± 1.930.000


Table 2. Peripheral Blood B-Cell Subpopulations in Patients With ITP and the Controls
 
Patients (N = 30)Control (N = 20)P-value
Mann-Whitney test. Data represented as mean ± SEM. P ≤ 0.05 is significant.
Total B lymphocytes13.94 ± 0.3011.62 ± 0.480.000
Naive B lymphocytes73.04 ± 2.2169.8 ± 1.80. 582
Total memory B cell26.48 ± 1.9631.20 ± 1.810.009
IgM memory B cells16.21 ± 1.1312.57 ± 1.180.03
Switched memory B cells10.25 ± 1.0416.90 ± 0.920.01
Regulatory B cells2.30 ± 0.153.64 ± 0.180.000


Table 3. Comparison of Some Studied Parameters in ITP Patients With Short and Long Duration of Illness
 
Patients with long duration (N = 9)Patients with short duration (N = 21)P-value
Mann-Whitney test. Data represented as mean ± SEM. P ≤ 0.05 is significant. MPV: mean platelet volume; WBCs: white blood cells.
Total B lymphocytes (%)13.63 ± 0.5114.08 ± 0.380.519
Naive B lymphocytes (%)74.11 ± 3.5375.44 ± 2.480.766
Total memory B cell (%)18.44 ± 2.2328.50 ± 2.360.01
IgM memory B cells (%)12.02 ± 1.5712.81 ± 1.160.767
Switched memory B cells (%)11.69 ± 1.8111.06 ± 1.300.788
Regulatory B cells (%)1.72 ± 0.212.54 ± 0.170.01
MPV (Femtoliter)9.42 ± 0.509.72 ± 0.300.799
Hemoglobin (g/dL)10.68 ± 0.3210.86 ± 0.260.711
WBCs (× 109/L)8.97 ± 0.717.57 ± 0.470.114
Platelet count (× 109/L)8.55 ± 0.6613.47± 0.920.003


Table 4. Correlations Between Some Studied Parameters in ITP Patients
 
Platelet countRegulatory B cellsIgM memory B cellsSwitched memory B cellsTotal B lymphocytesTotal memory B cellsNaive B cells
Spearman’s correlation.
Regulatory B cell0.665*
P = 0.000
1-0.491*
P = 0.04
0.259
P = 0.07
-0.393*
P = 0.005
0.423*
P = 0.002
-0.208
P = 0.15
IgM memory B cells-0.363*
P = 0.01
-0.491*
P = 0.04
1-0.819*
P = 0.000
0.413*
P = 0.003
-0.621*
P = 0.000
0.294*
P = 0.078
Switched memory B cells0.391*
P = 0.005
0.259
P = 0.07
-0.819*
P = 0.000
1-0.373*
P = 0.008
0.683*
P = 0.000
-0.268
P = 0.512
Total B lymphocytes-0.451*
P = 0.01
-0.393*
P = 0.005
0.413*
P = 0.003
-0.373*
P = 0.008
1-0.371*
P = 0.008
0.401*
P = 0.004
Total memory B cells0.389*
P = 0.005
0.423*
P = 0.002
-0.621*
P = 0.000
0.683*
P = 0.000
-0.371*
P = 0.008
1-0.232*
P = 0.651
Naive B cells-0.342*
P = 0.01
-0.208
P = 0.15
0.294*
P = 0.078
-0.268*
P = 0.512
0.401*
P = 0.004
-0.232*
P = 0.615
1