Figures
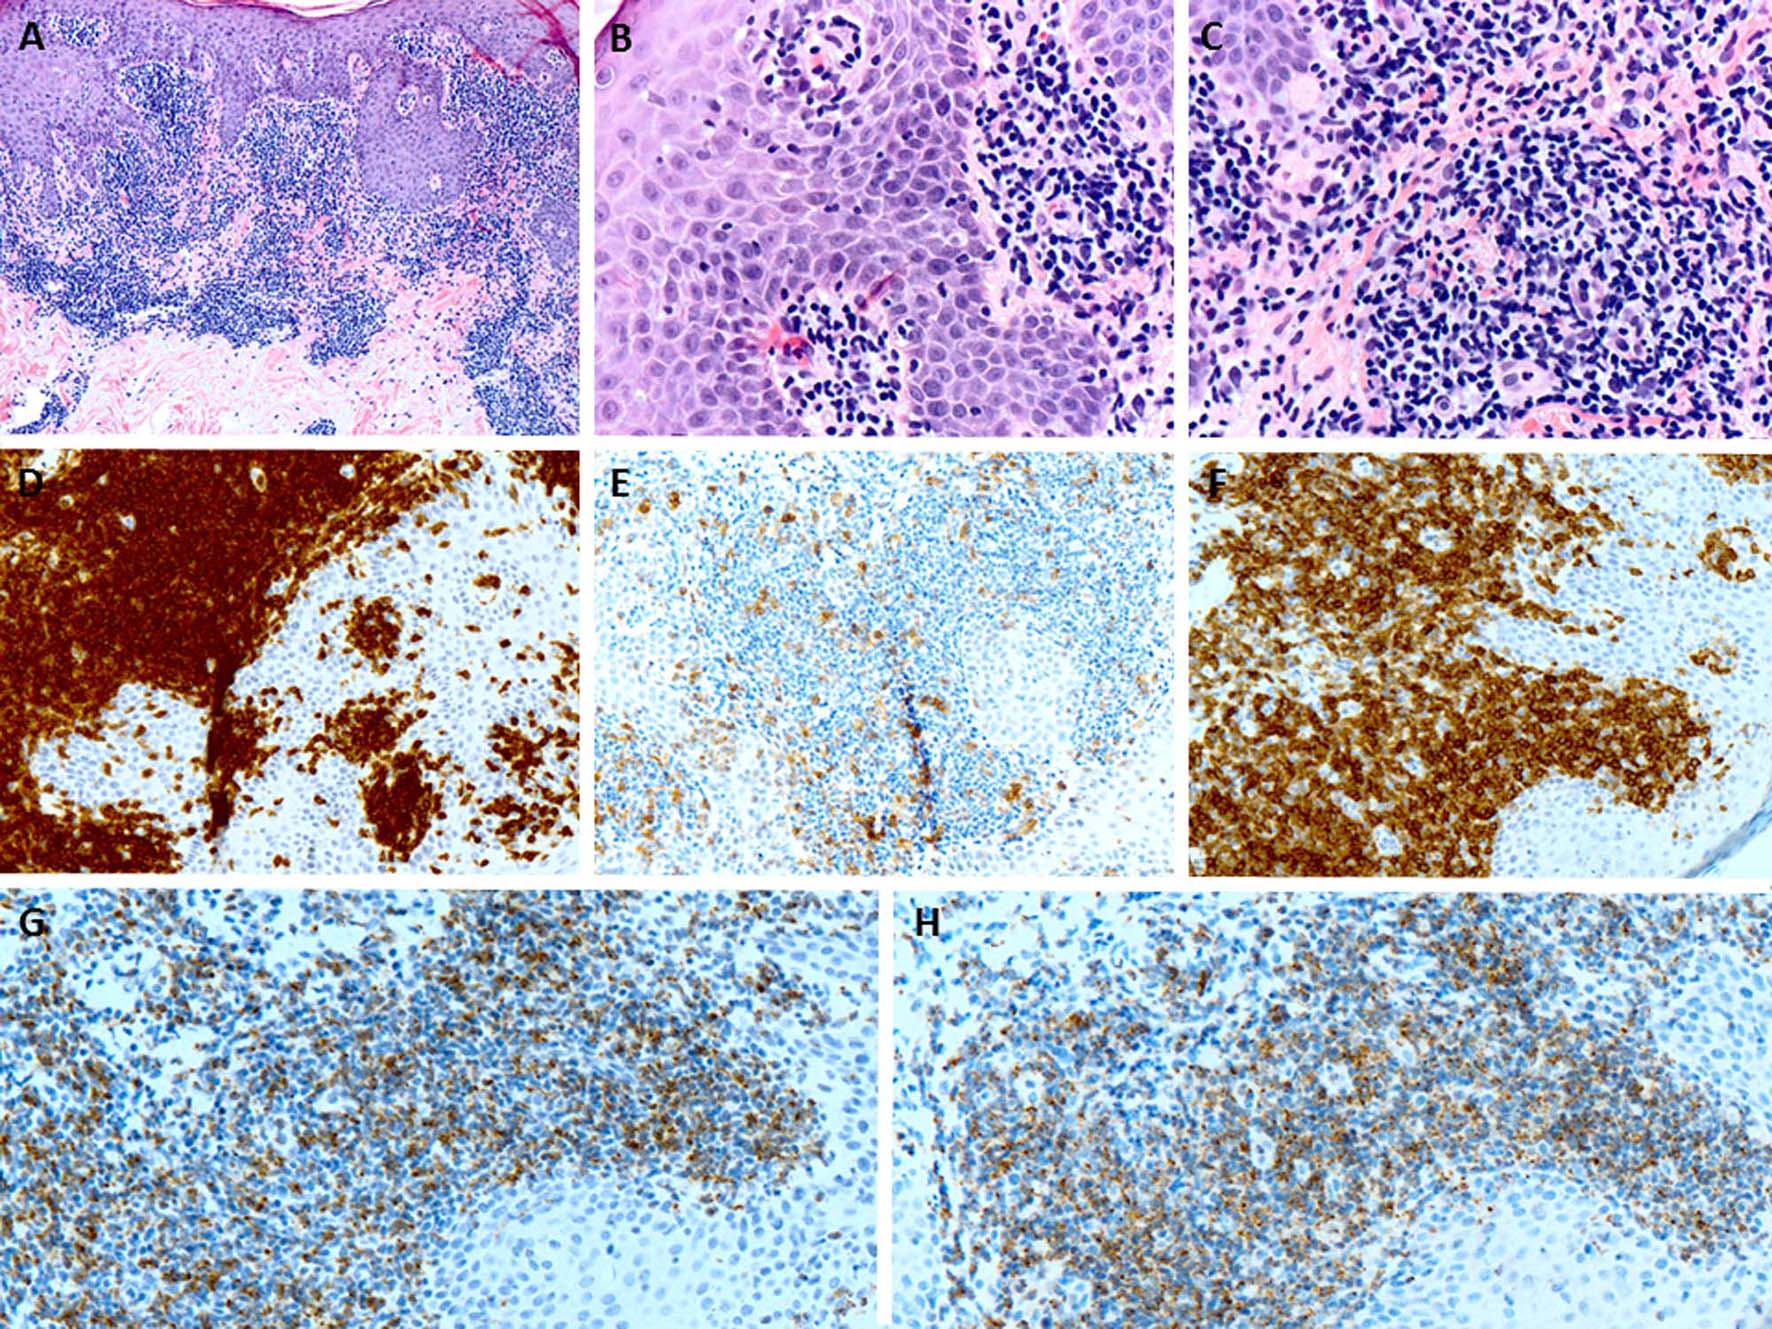
Figure 1. (A) The punch biopsy of the skin lesion shows a dense atypical lymphoid infiltrate predominantly in the dermis (H&E, × 100). (B) The lymphoid infiltrate shows minimal epidermotropism (H&E, × 400). (C) The lymphoid cells are small to medium-sized and have mature chromatin and irregular nuclear contours (H&E, × 400). (D) The lymphoid cells are CD3-positive T cells (× 200). (E) CD4 shows minimal scattered staining (× 200). (F) The atypical cells largely positive for CD8 (× 200). (G, H) The cytotoxic proteins including granzyme B and TIA-1 are positive in atypical lymphoid cells respectively (× 200).
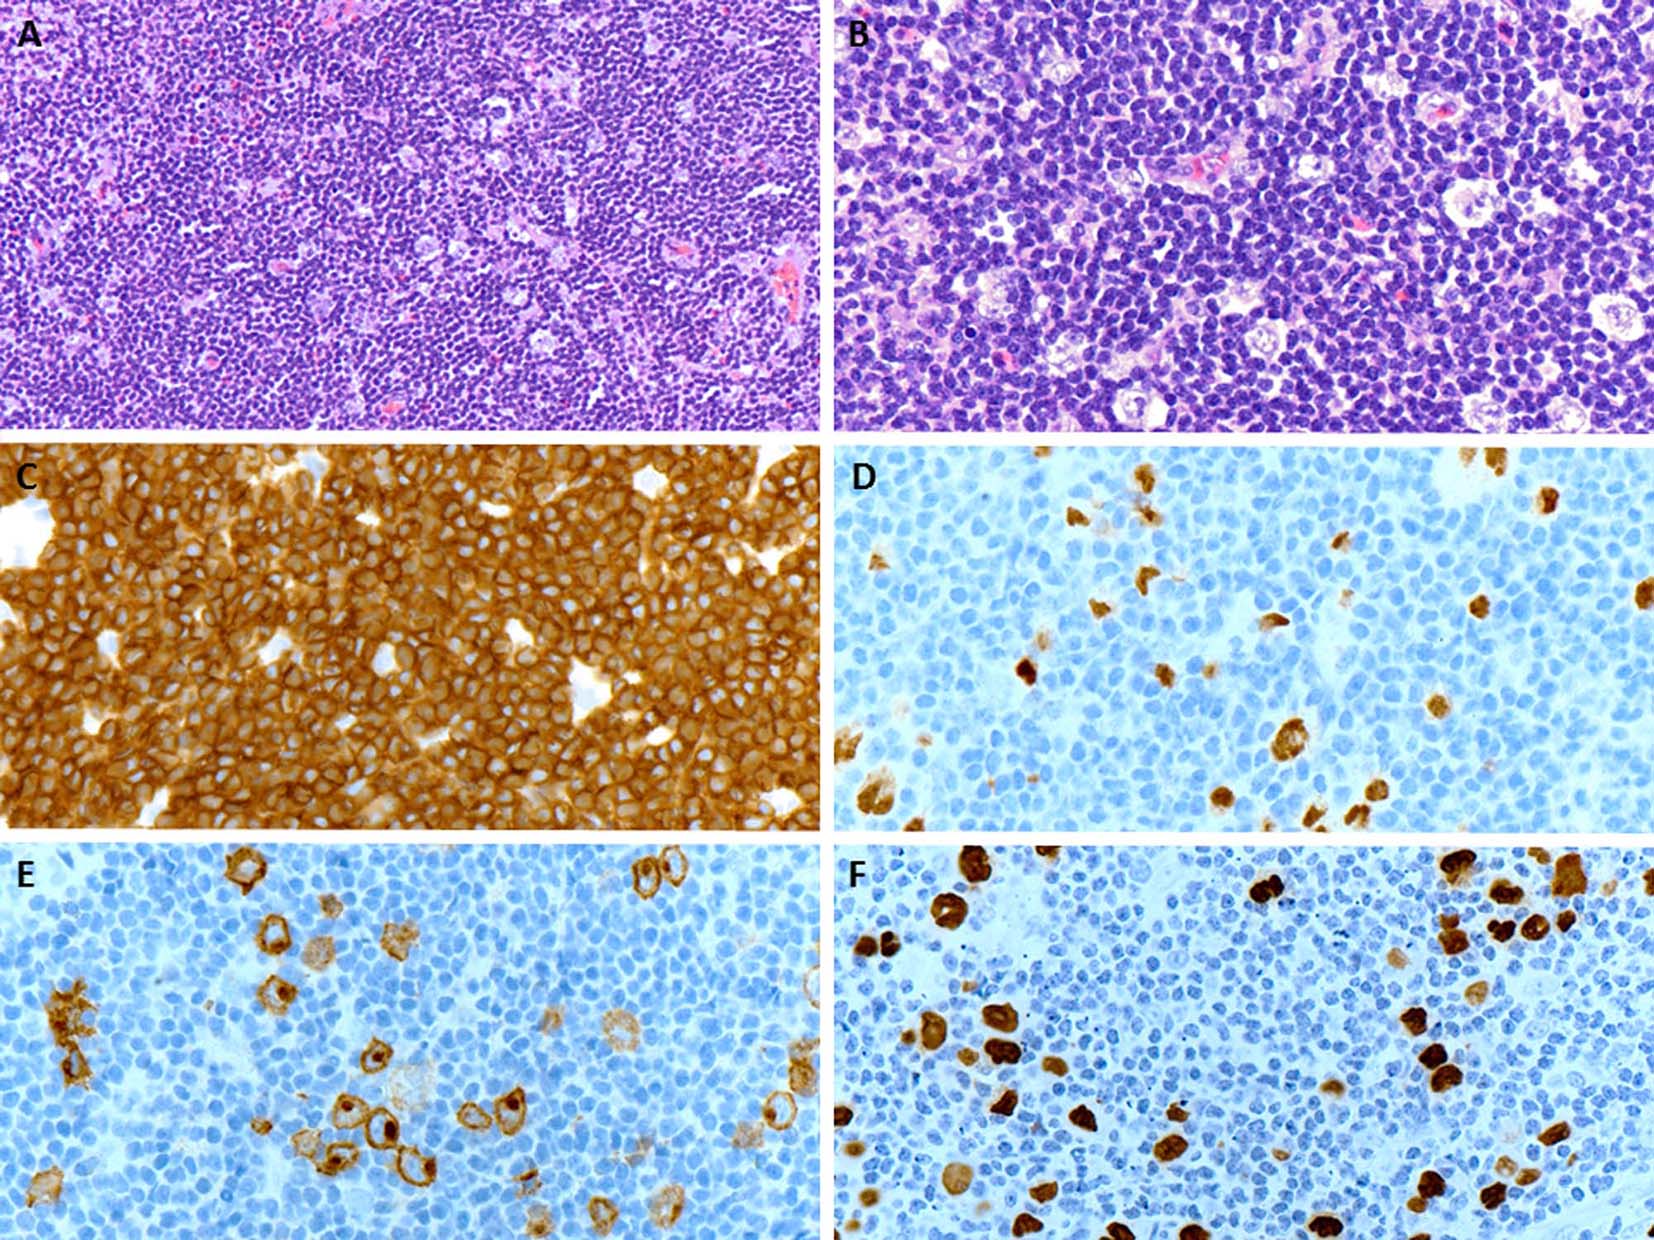
Figure 2. (A) An excisional biopsy of the axillary lymph node shows a nodal effacement by diffuse infiltrate of small and mature lymphocytes (H&E, × 200). (B) Loose clusters of larger “lacunar” type Hodgkin cells are also appreciated on higher magnification (H&E, × 400). (C) The neoplastic population of small and mature lymphocytes are diffusely positive for CD3 (× 400). (D, E) The large Hodgkin cells are positive for Pax5 and CD30 (membranous and Golgi staining), respectively (× 400). (F) The in situ hybridization for EBV is positive in Hodgkin cells (× 400).
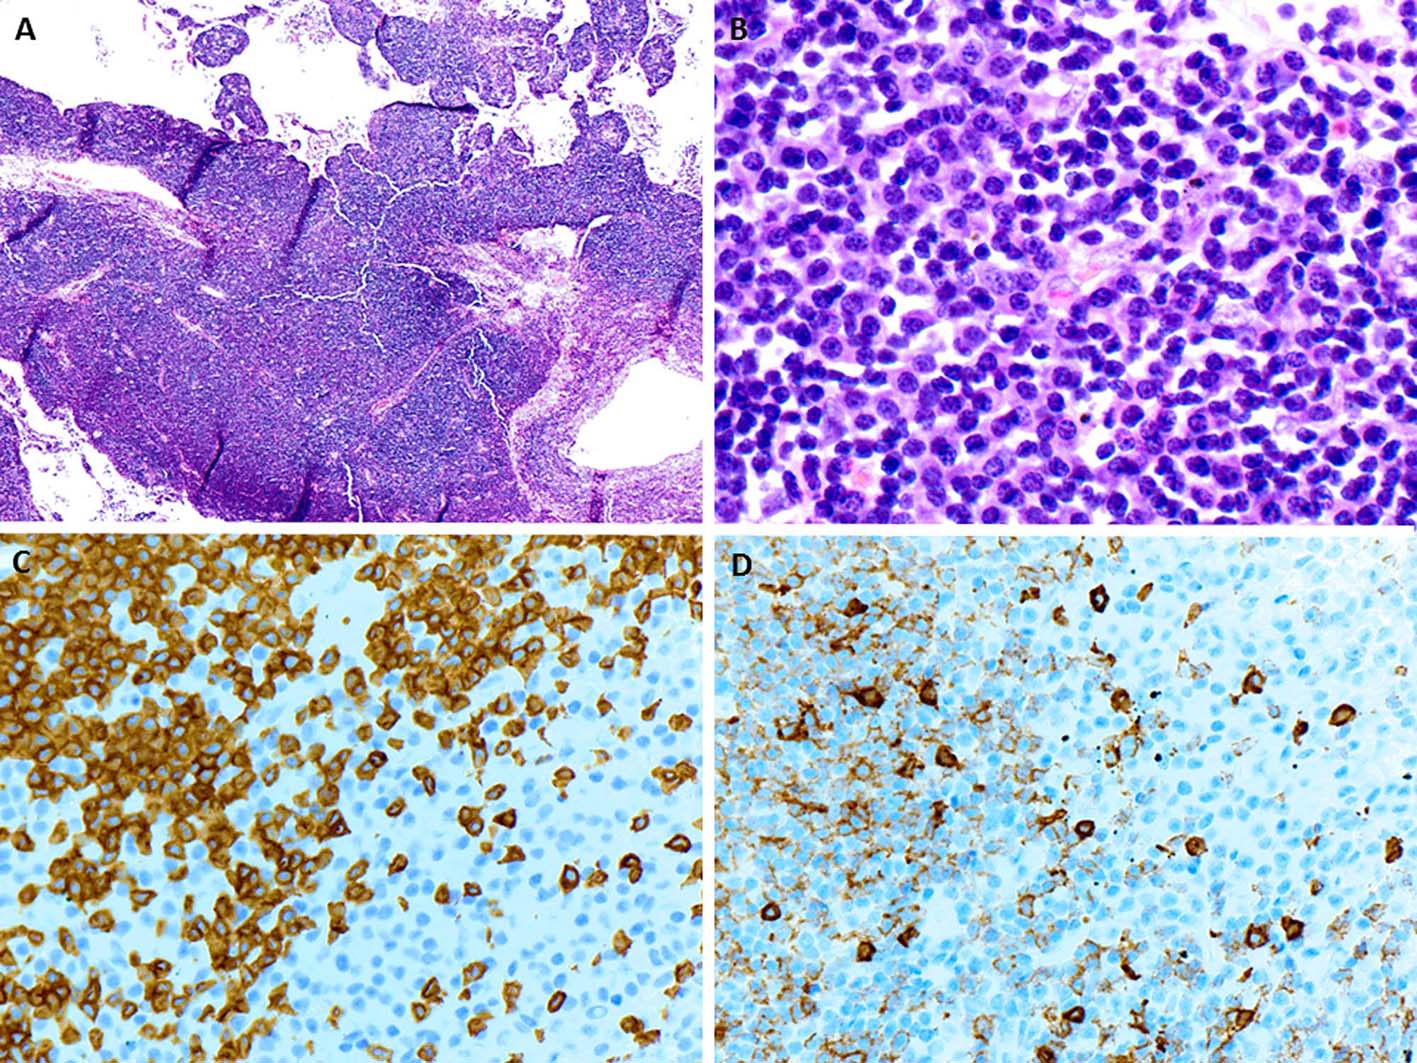
Figure 3. (A) The wedge resection of right lower lobe of lung shows a diffuse infiltrate predominantly around vessels, bronchi and alveolar walls (H&E, × 40). (B) On higher magnification, loose clusters of mature plasma cells are intimately associated with neoplastic population of mature lymphocytes (H&E, × 600). (C, D) The neoplastic lymphocytes are positive for CD3 and weakly for CD8 respectively while the clusters of plasma cells are negative for both (× 400).
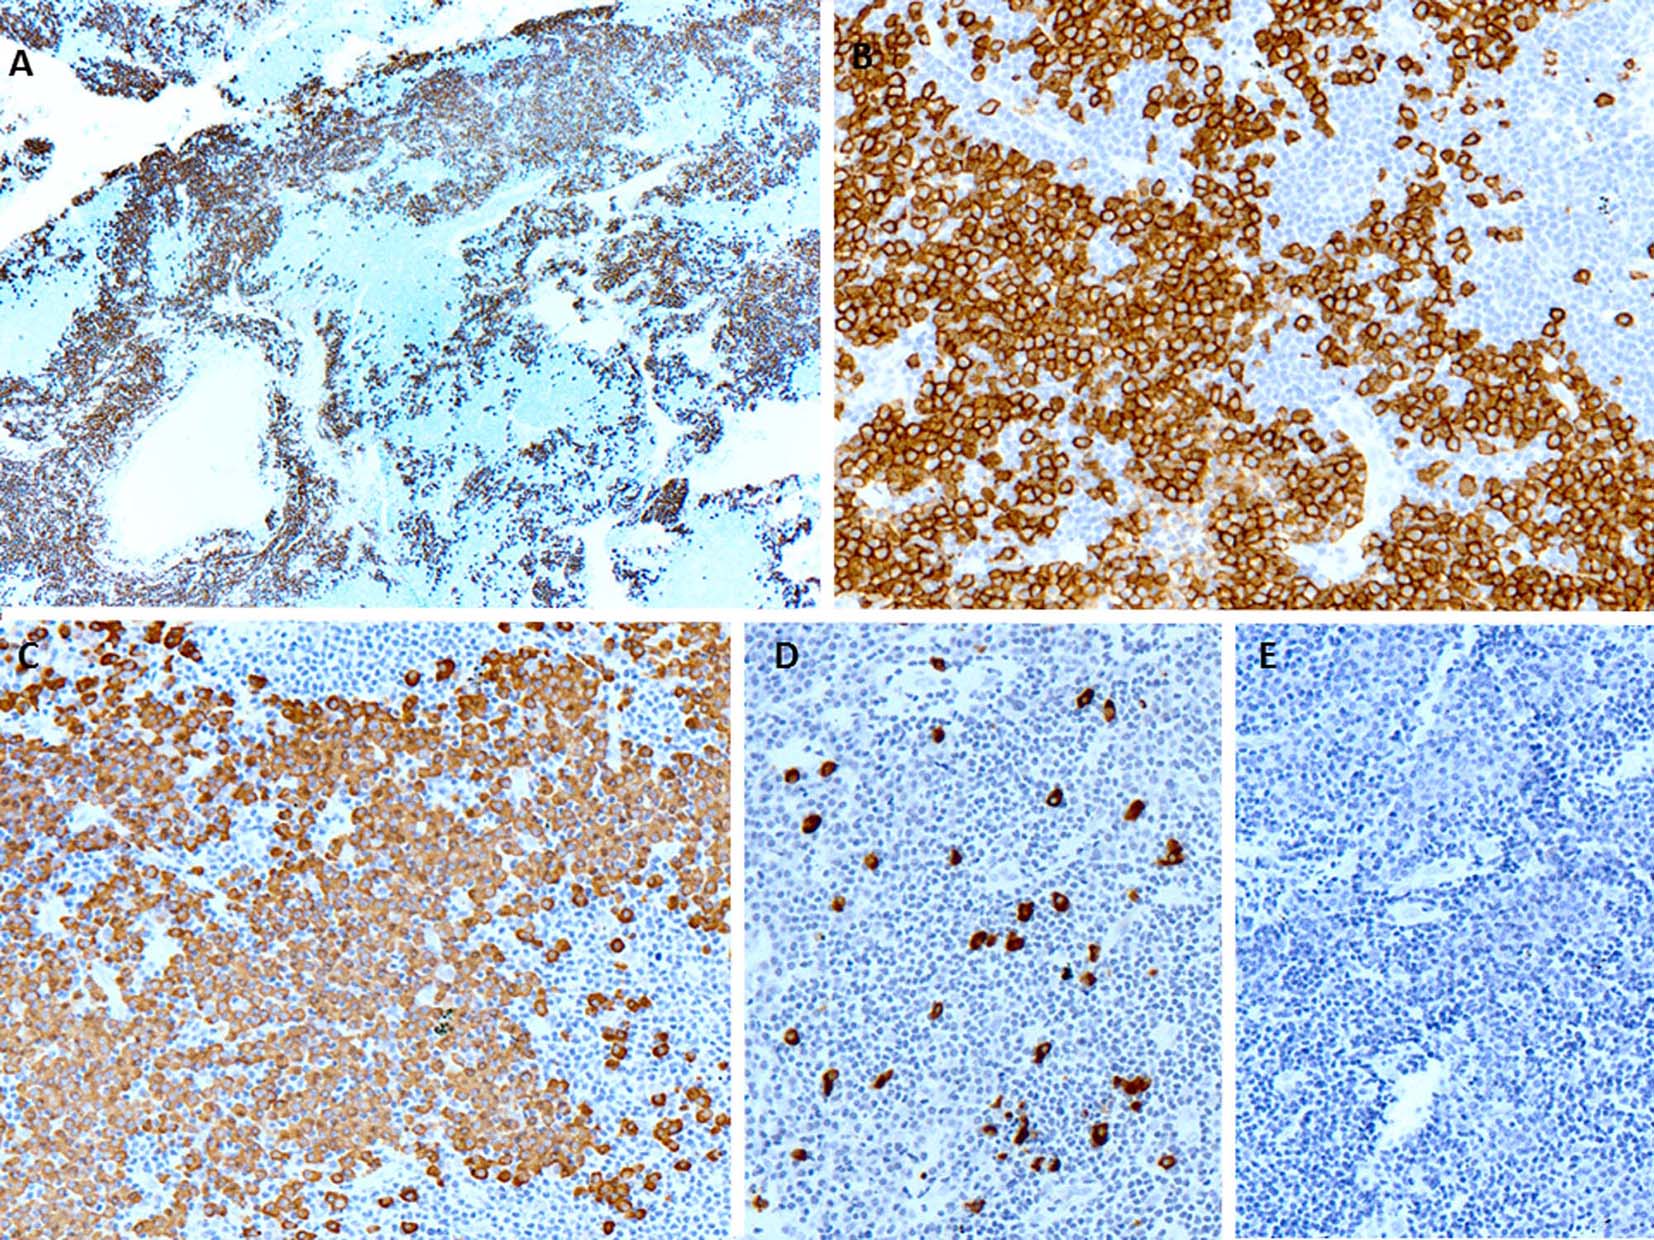
Figure 4. (A, B) CD138 immunostaining shows large clusters and sheets of plasma cells closely associated with negative neoplastic T lymphocytic population (× 40 and × 200, respectively). (C) The plasma cells show monotypic κ light chains by in situ hybridization (× 200). (D) The in situ hybridization for λ light chains shows marked paucity (× 200). (E) The in situ hybridization for EBV is negative (× 200).
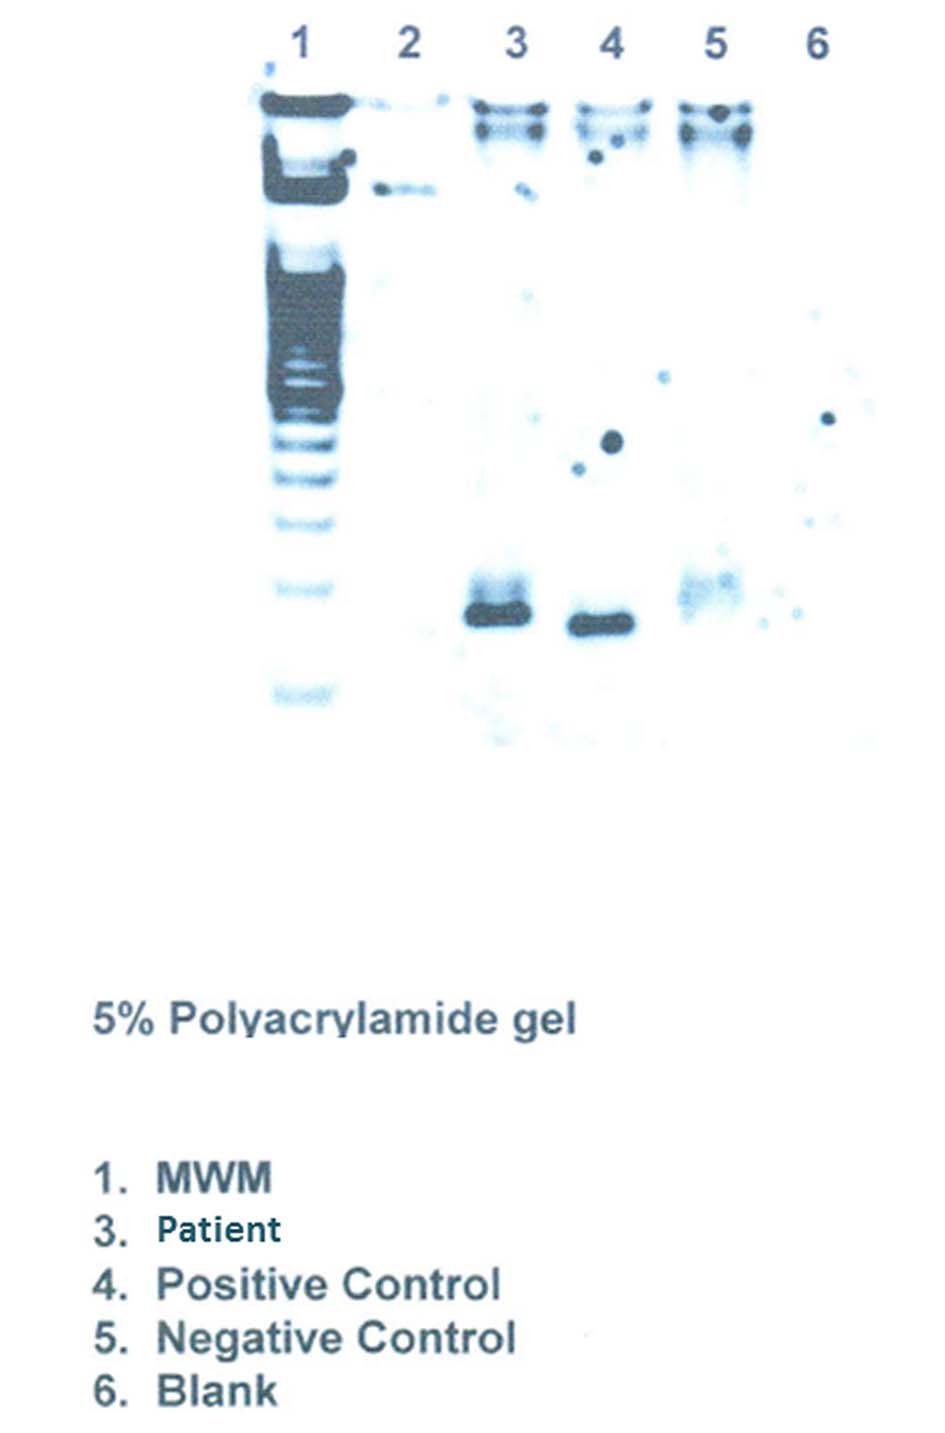
Figure 5. Clonality studies on the lung tissue shows TCR-γ gene rearrangement.
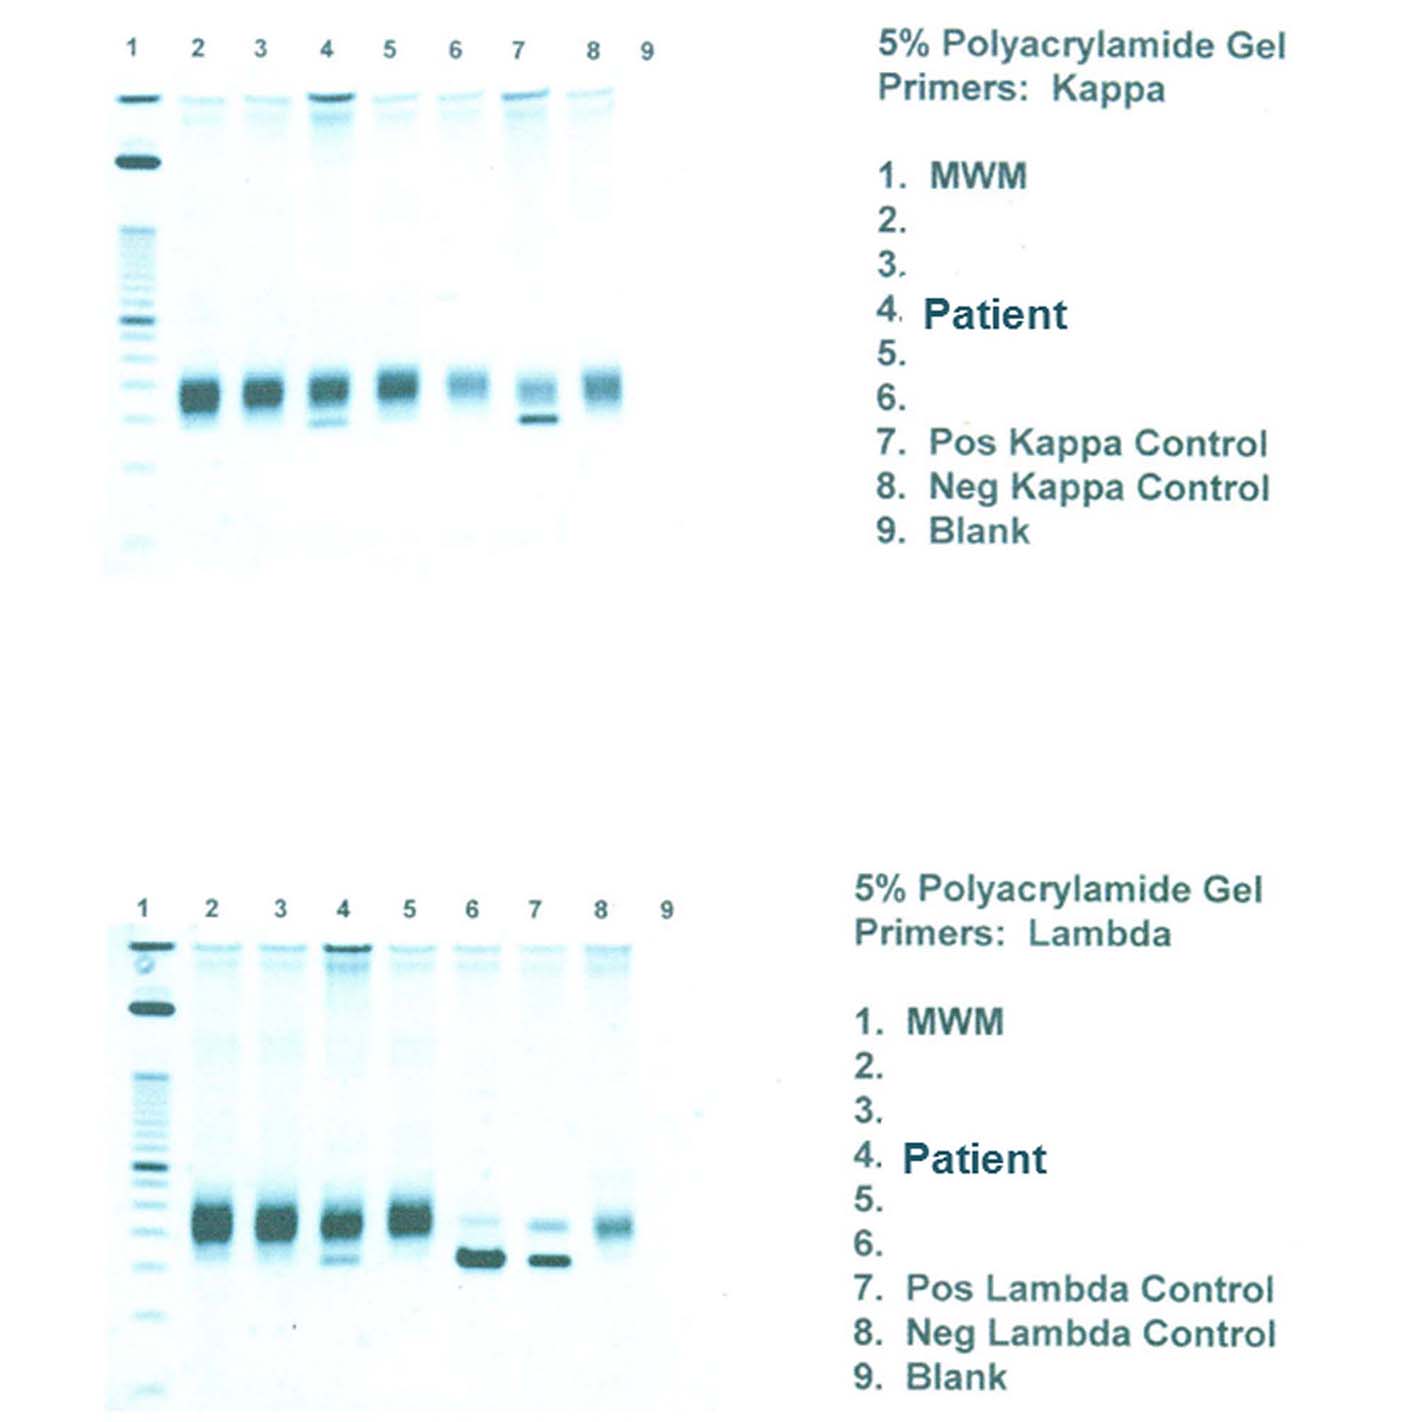
Figure 6. PCR for light chain immunoglobulin gene rearrangement shows clear monoclonal bands in both κ and λ light chains.
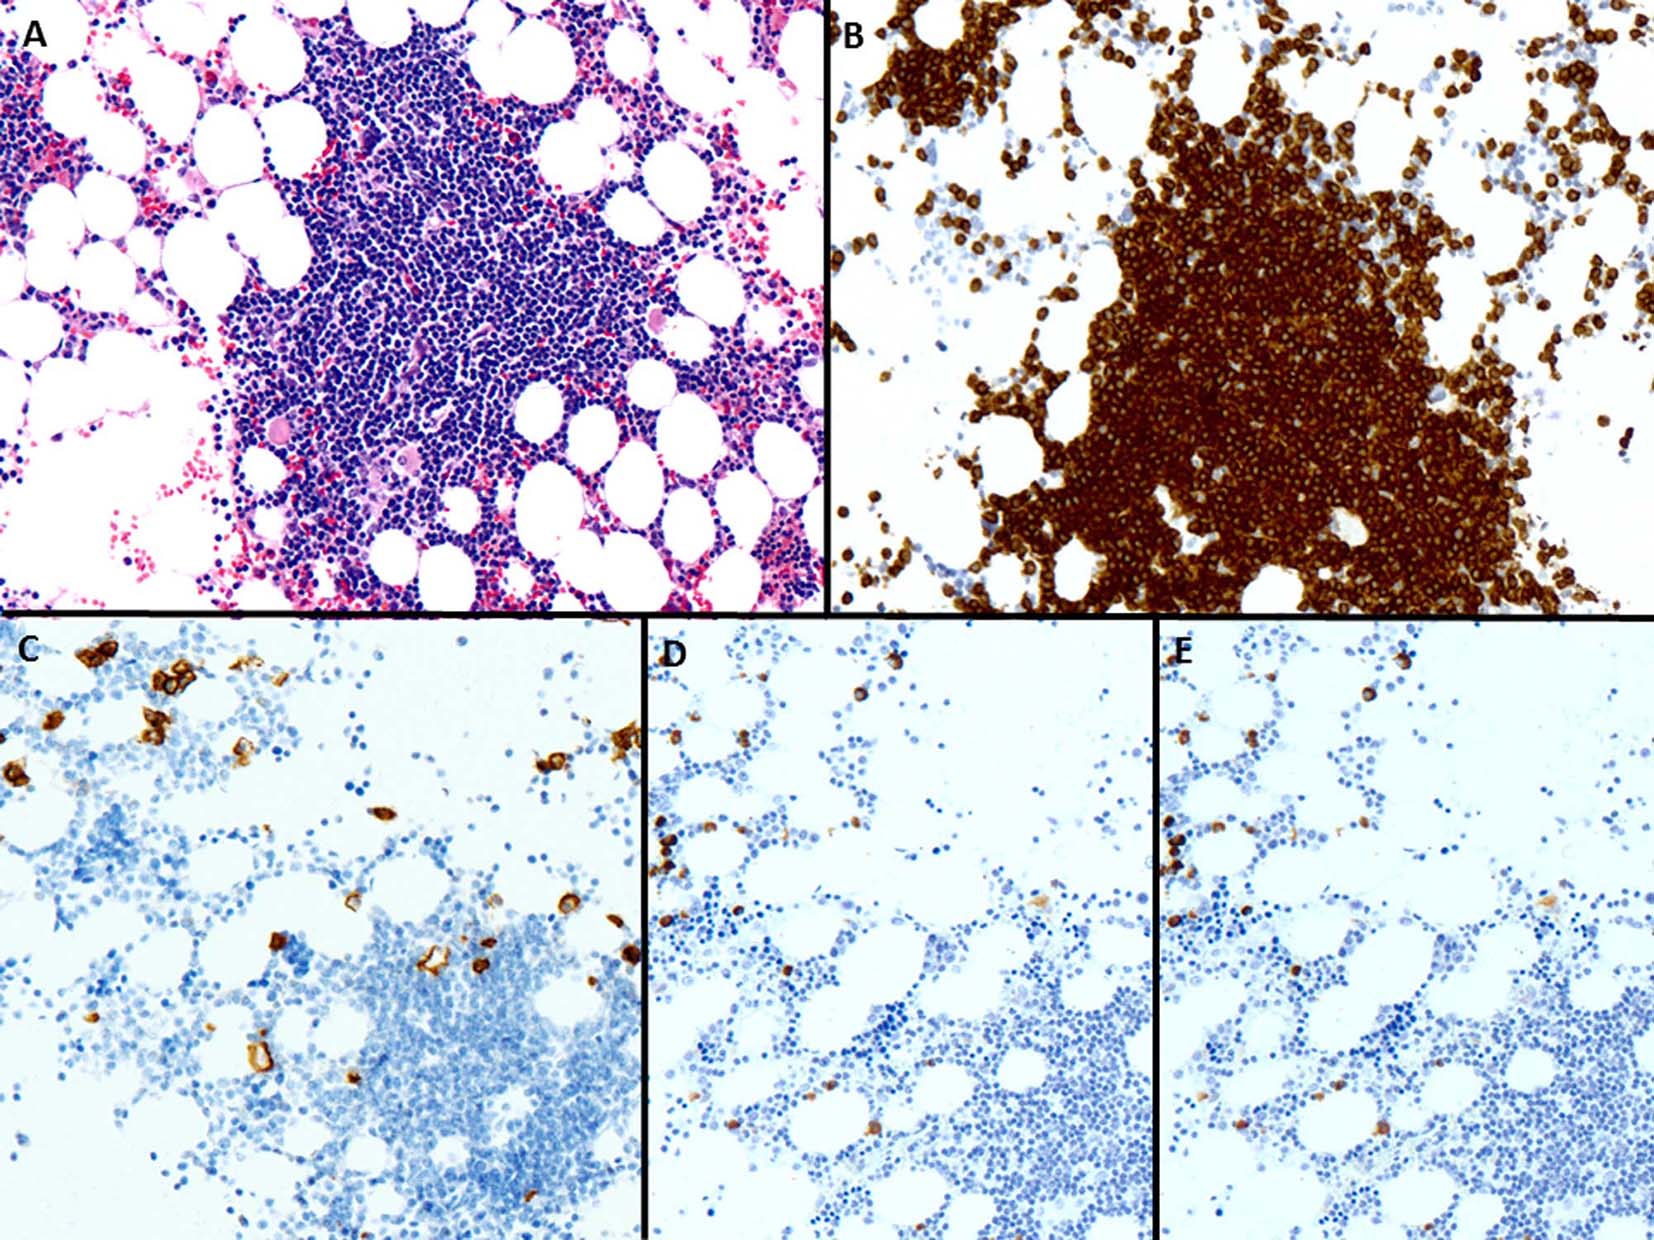
Figure 7. (A) The bone marrow biopsy shows infiltration by small and mature lymphocytes (H&E, × 200). (B) CD3 is positive in lymphoid cells (× 200). (C) CD138 shows few scattered plasma cells (× 200). (D, E) The plasma cells are polyclonal by κ and λ in situ hybridization, respectively (× 200).