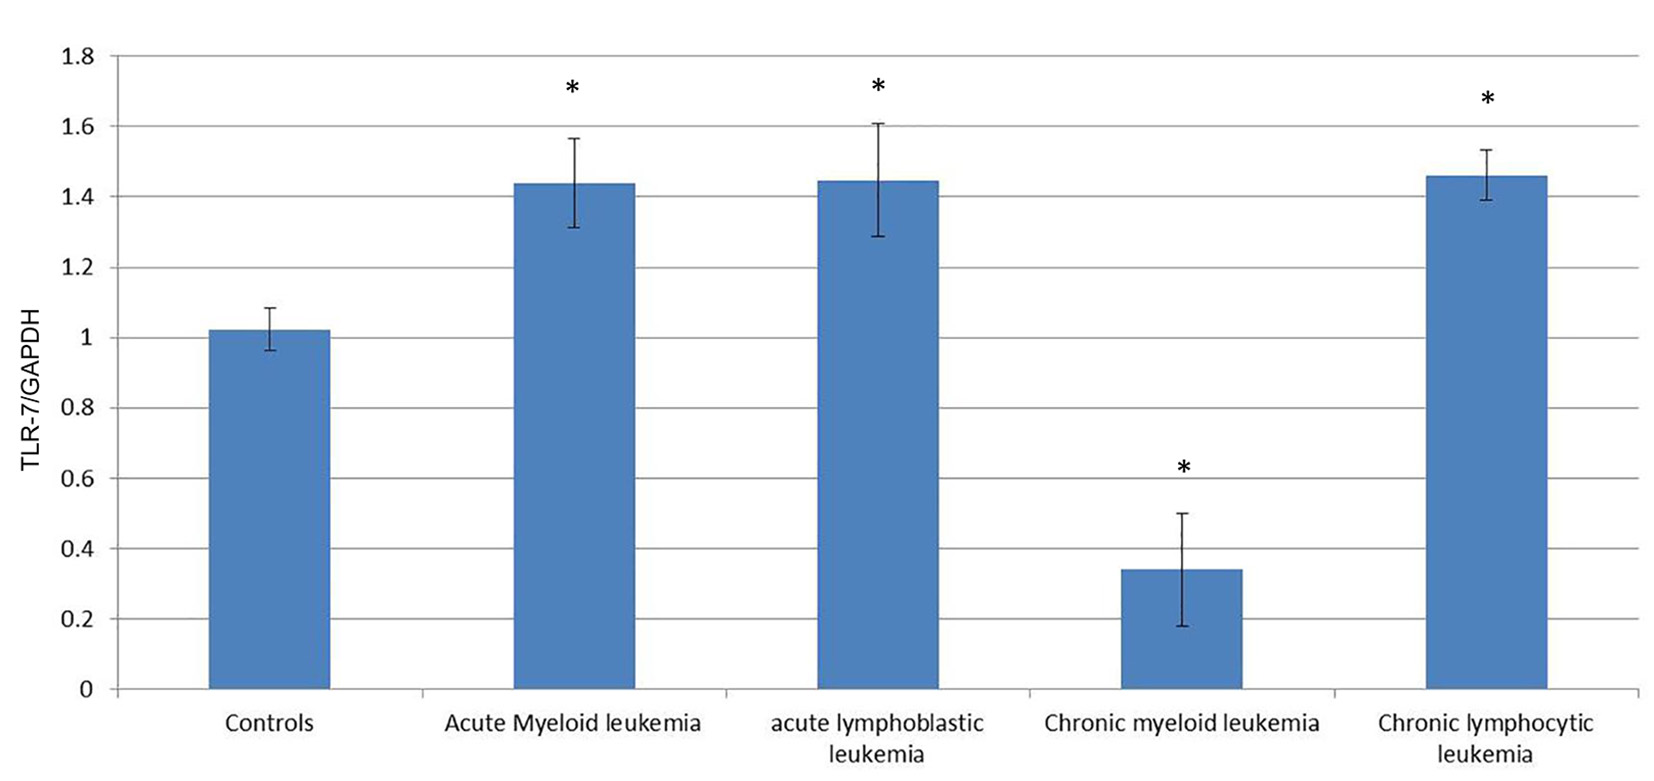
Figure 1. Comparison of the expression of TLR-7/GAPDH mRNA in PBMCs between different groups.
| Journal of Hematology, ISSN 1927-1212 print, 1927-1220 online, Open Access |
| Article copyright, the authors; Journal compilation copyright, J Hematol and Elmer Press Inc |
| Journal website http://www.thejh.org |
Original Article
Volume 5, Number 1, March 2016, pages 17-24
Quantitative Expression of Toll-Like Receptors TLR-7 and TLR-9 on Peripheral Blood Mononuclear Cells in Leukemias
Figures
Tables
| Controls (n = 30) | Acute myeloid leukemia (n = 15) | Acute lymphoblastic leukemia (n = 15) | Chronic myeloid leukemia (n = 15) | Chronic lymphocytic leukemia (n = 15) | |
|---|---|---|---|---|---|
| *P < 0.05. | |||||
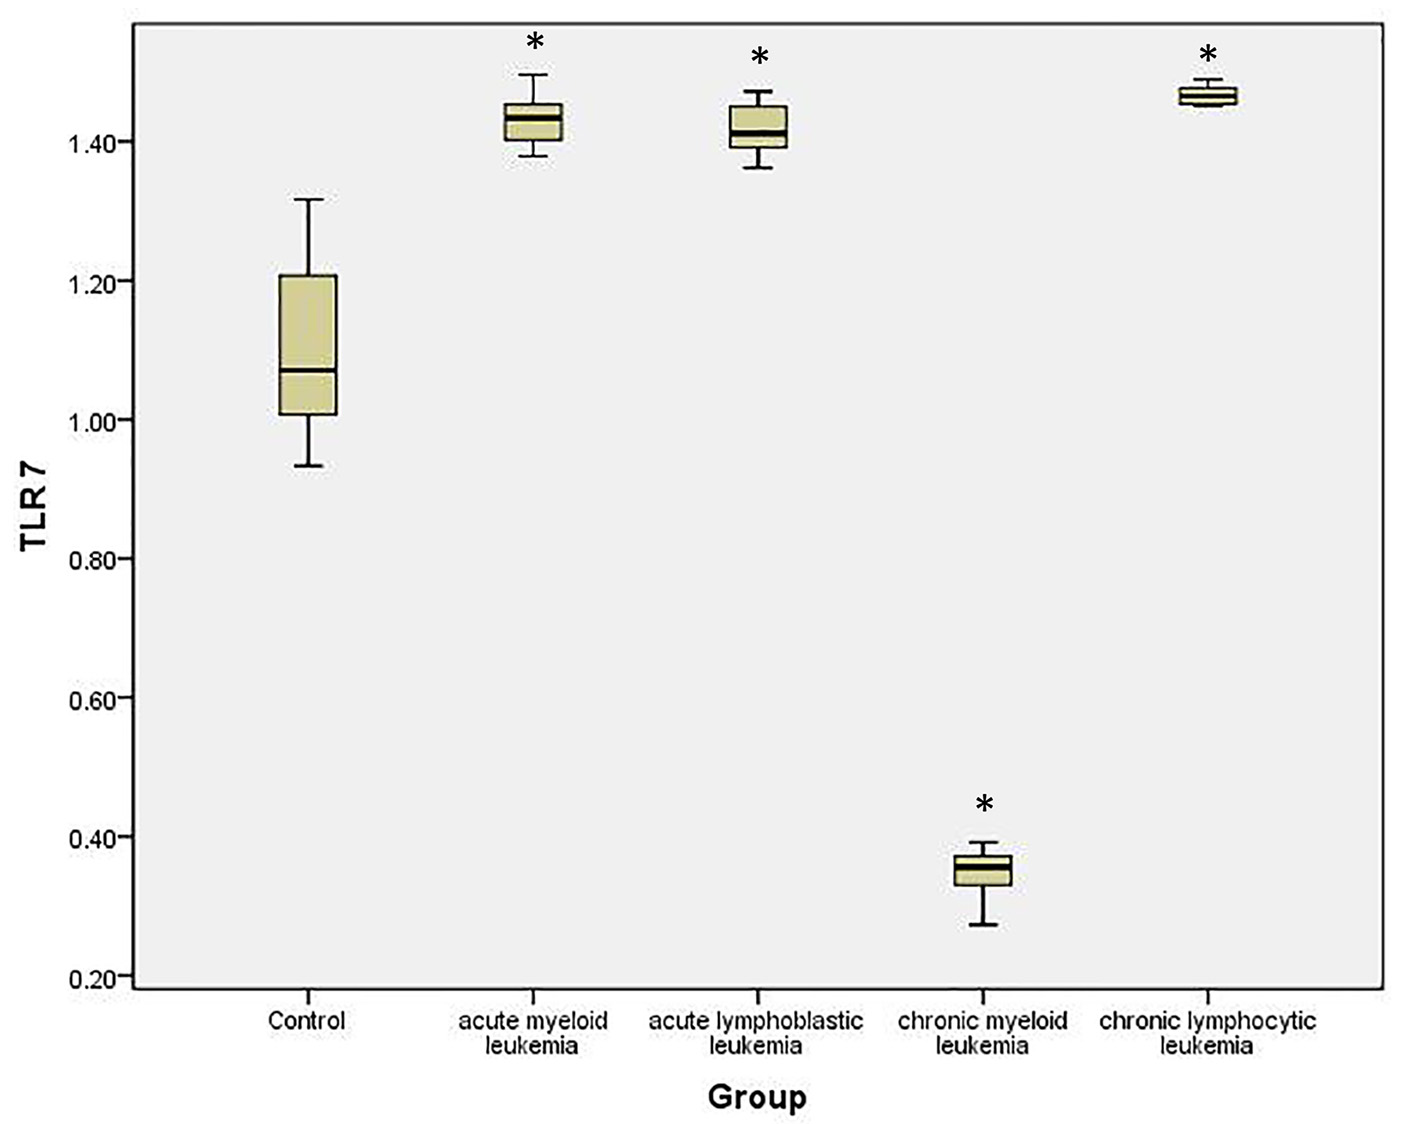
| TLR-7, range (mean ± SD) | 0.929 - 1.341 (1.023 ± 0.061) | 1.37 - 1.51 (1.44 ± 0.126) | 1.361 - 1.482 (1.447 ± 0.1611) | 0.272 - 0.396 (0.341 ± 0.16) | 1.447 - 1.491 (1.462 ± 0.071) |
| T | 2.11 | 2.98 | 8.01 | 2.11 | |
| P | 0.013* | 0.011* | 0.001* | 0.016* | |
| Controls (n = 30) | Acute myeloid leukemia (n = 15) | acute lymphoblastic leukemia (n = 15) | Chronic myeloid leukemia (n = 15) | Chronic lymphocytic leukemia (n = 15) | |
|---|---|---|---|---|---|
| *P < 0.05. | |||||
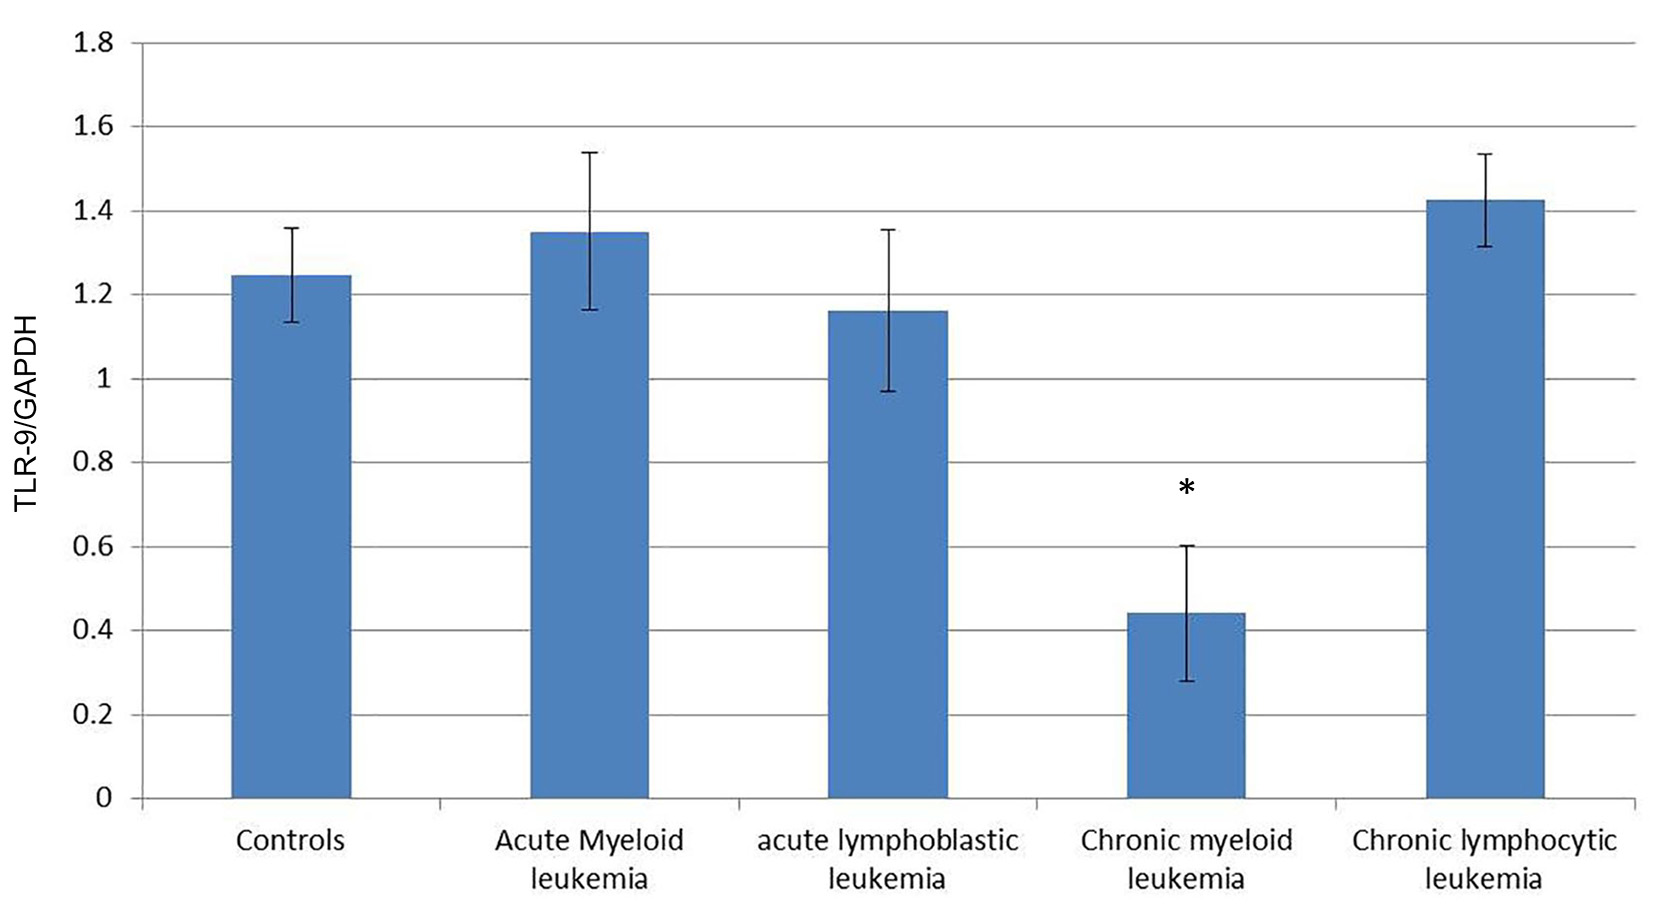
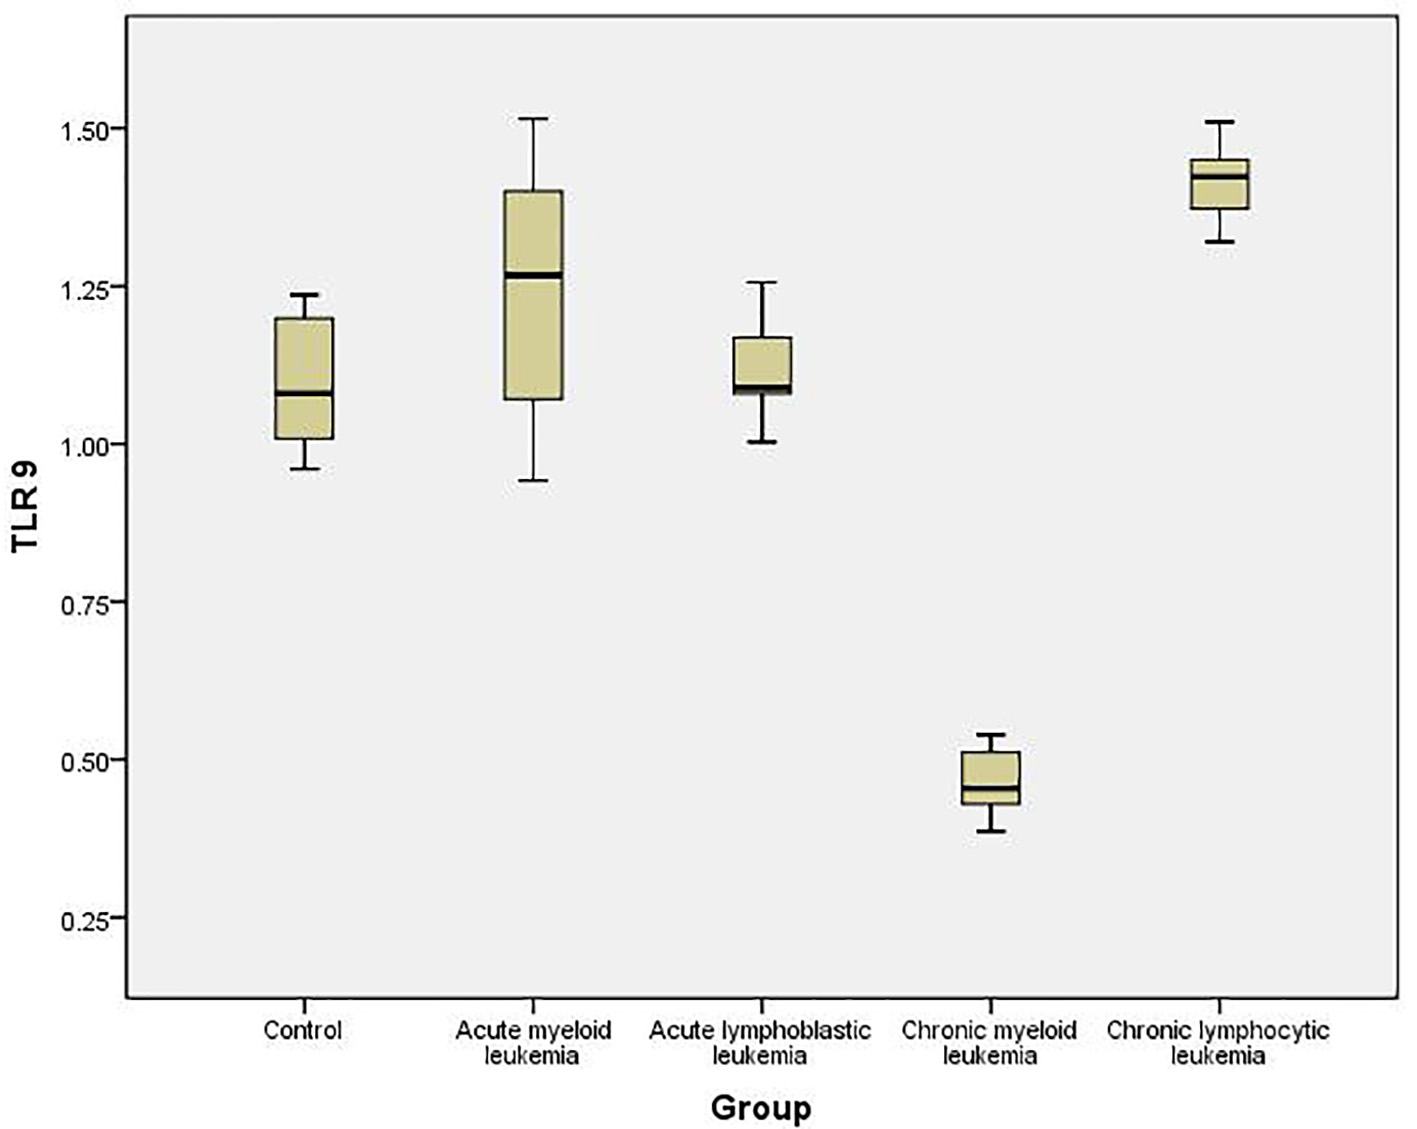
| TLR-9, range (mean ± SD) | 0.943 - 1.492 (1.245 ± 0.112) | 0.941 - 1.571 (1.35 ± 0.187) | 0.9628 - 1.279 (1.162 ± 0.191) | 0.380 - 0.540 (0.442 ± 0.161) | 1.36 - 1.51 (1.425 ± 0.11) |
| T | 0.98 | 1.68 | 7.25 | 2.85 | |
| P | 0.365 | 0.071 | 0.001* | 0.031* | |