Journal of Hematology, ISSN 1927-1212 print, 1927-1220 online, Open Access
Article copyright, the authors; Journal compilation copyright, J Hematol and Elmer Press Inc
Journal website http://www.thejh.org

Original Article

Volume 5, Number 1, March 2016, pages 8-16


Associations Between Initial Presentation of Multiple Myeloma and Renal Function: the Experience of Two European Centers

Figures

Figure 1.
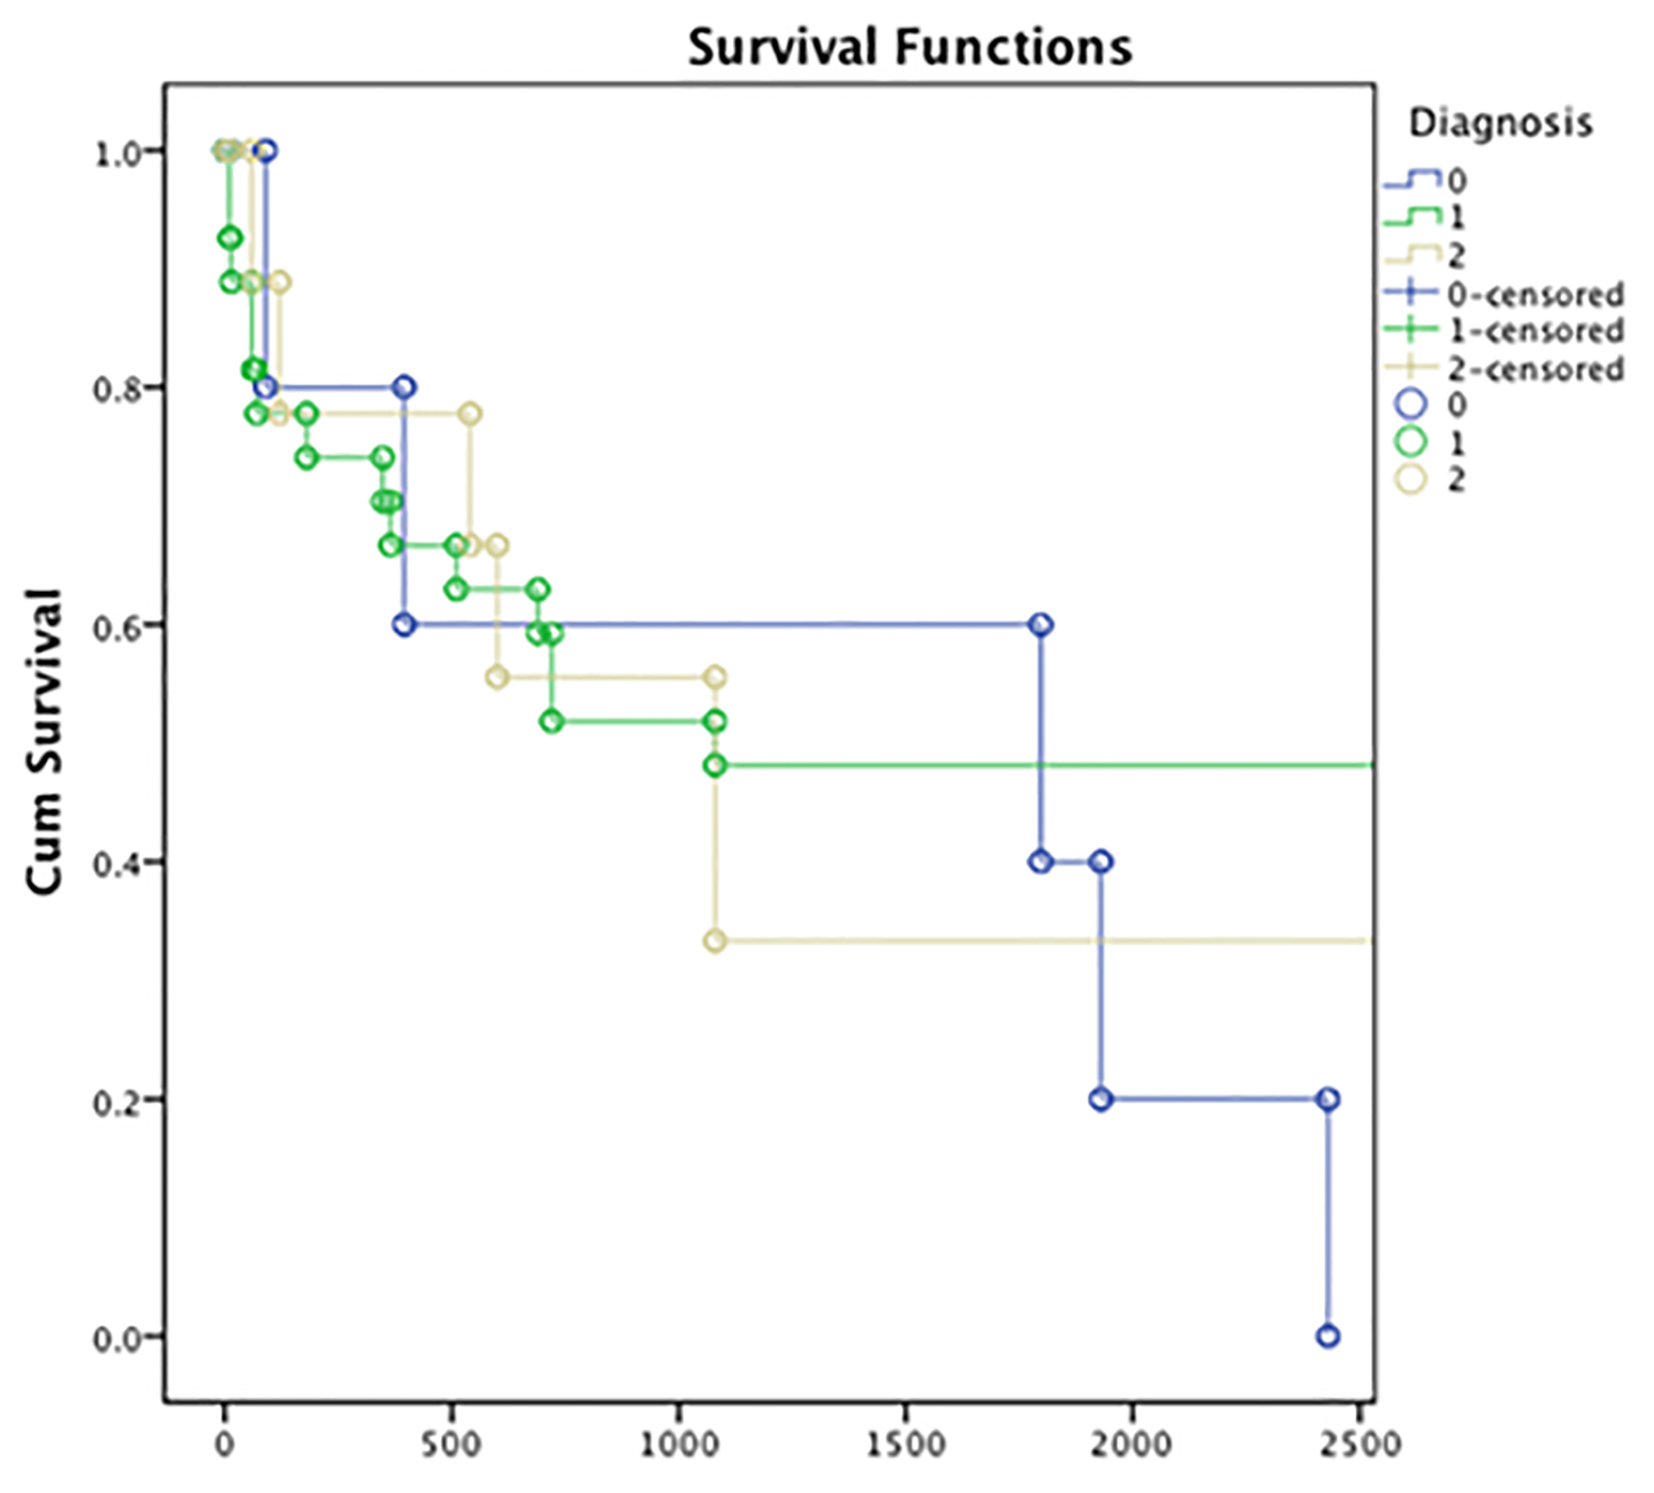
Figure 1. Survival rate in the 41 patients with para-protein related biopsy findings according to the renal pathological diagnosis (MCN, LCDD, and AL-amyloidosis). Y axis: cumulative survival; x-axis: length of follow-up in days. Group 0: AL-amyloid (blue); group 1: MCN (green); group 2: LCDD (yellow). MCN: myeloma cast nephropathy; LCDD: light chain deposition disease.
Figure 2.
Figure 2. The 12-month survival in NRI (no renal impairment) and AKI (acute kidney injury) in UK patients. Group 1 (blue): NRI patients; group 2 (red): AKI patients. Y-axis: survival probability; x-axis: length of follow-up in months.
Figure 3.
Figure 3. The 12-month survival between chemotherapy treated vs. untreated UK patients. Red: chemotherapy treated; blue: untreated cohort. Y-axis: survival probability; x-axis: length of follow-up in months.

Tables

Table 1. Demographic, Renal and Hematological Features
 
NRIAKIP
CVE: cardiovascular event; AF: atrial fibrillation; MGUS: monoclonal gammopathy of unknown significance; eGFR: estimated glomerular filtration rate; FKLC: free kappa light chain; FLLC: free lambda light chain; KLR: kappa lambda ratio; Hb: hemoglobin; WBC: white blood cell.
Age63.82 ± 13.06 years67.03 ± 10.52 years0.043
Male gender53.1%61%0.230
CVE16.7%17.1%0.942
Diabetes13.4%5.8%0.205
Hypertension36.4%35.5%0.896
AF12.2%12.5%1.00
MGUS11.7%18.1%0.170
Previous cancer6.1%6.6%0.432
Sodium138.4 ± 3.8 mmol/L137.0 ± 4.7 mmol/L0.01
Potassium4.2 ± 0.4 mmol/L4.4 ± 0.7 mmol/L0.002
Urea6.1 ± 2.6 mmol/L20.5 ± 13.8 mmol/L< 0.001
eGFR85.52 ± 13.4 mL/min/1.73 m223.21 ± 21.3 mL/min/1.73 m2< 0.001
Calcium2.3 ± 0.2 mmol/L2.54 ± 0.4 mmol/L0.006
Phosphate1.08 ± 0.4 mmol/L1.61 ± 0.7 mmol/L< 0.001
Albumin38.7 ± 6.2 g/L34.6 ± 7.7 g/L< 0.001
Proteinuria0.4 ± 0.6 g/24 h1.86 ± 1.8 g/24 h< 0.001
Plasma cells (%)25.1 ± 20.835.3 ± 26.50.01
IgA4.3 ± 11.9 g/L7.07 ± 14.3 g/L0.67
IgM0.4 ± 0.4 g/L1.6 ± 8.3 g/L0.14
FKLC503.1 ± 1,523.7 mg/L2,297.2 ± 4,822.9 mg/L0.01
FLLC494.2 ± 1,685.5 mg/L1,464.3 ± 3,084.9 mg/L0.04
KLR36.1 ± 115.6385 ± 962.70.02
Paraprotein22.8 ± 14.7 g/L24.7 ± 19.5 g/L0.53
Hb118.98 ± 19.9 g/L94.54 ± 17.5 g/L< 0.001
WBC6.5 ± 2.7 × 10⁹/L7.9 ± 3.5 × 10⁹/L0.004
Platelets239.5 ± 81 × 109/L219.4 ± 102.9 × 10⁹/L0.14


Table 2. Comparison Between the Two European Centers
 
UK groupItalian groupP
CVE: cardiovascular events; AF: atrial fibrillation; MGUS: monoclonal gammopathy of unknown significance.
Age66.7 ± 11.5 years65.3 ± 14.3 years0.092
Male gender55%56.5%0.830
CVE17.4%25%0.582
Diabetes11.9%26.7%0.099
Hypertension37.2%54.10.052*
AF9.2%18.2%0.320
MGUS7%42%0.000*
Cancer6.9%20%0.038*


Table 3. Clinical and Laboratory Features According to the Renal Pathologic Diagnosis
 
MCN (51%)LCDD (17%)AL-amyloidosis (9.4%)P
Age65 ± 7.6 years60 ± 14.0 years72 ± 8.0 years0.1
eGFR9.1 ± 4.4 mL/min/1.73 m225.4 ± 23.5 mL/min/1.73 m247.5 ± 39.4 mL/min/1.73 m20.001
Hb89.7 ± 11.8 g/L102.2 ± 24.1 g/L131.7 ± 13.8 g/L0.001
PLT179.1 ± 99.7 × 10⁹/L289.2 ± 114.8 × 10⁹/L210.7 ± 90.0 × 10⁹/L0.038
TP72.2 ± 17.9 g/L68.3 ± 13.0 g/L52.4 ± 4.4 g/L0.05
% PC29.2 ± 21.315 ± 9.76.2 ± 4.50.04


Table 4. Most common causes of death in the entire population
 
Causes of deathPatients (%)
MOF: multi-organ failure; DIC: disseminated intravascular coagulation; MI: myocardial infarction.
Infection56 (76.9%)
Uremia6 (8.2%)
MOF3 (4.1%)
Bleeding/DIC3 (4.1%)
MI3 (4.1%)
Malignancy1 (1.3%)
Stroke1 (1.3%)


Table 5. Backwards and Forwards Cox’s Model for Death in the UK Subgroup
 
HRP
AF: atrial fibrillation; FKLC: free kappa light chain.
Backwards Cox’s model
  AF5.17 (0.57 - 46.97)0.144
  Age1.08 (0.98 - 1.19)0.104
  % Plasma cells1.05 (1.01 - 1.09)0.015
  Proteinuria0.36 (0.12 - 1.04)0.059
  Paraprotein1.04 (1 - 1.09)0.053
Forwards Cox’s model
  AF8.76 (0.73 - 104.77)0.087
  Age1.1 (0.99 - 1.22)0.069
  % Plasma cells1.06 (1.01 - 1.12)0.01
  Proteinuria0.28 (0.09 - 0.93)0.037
  FKLC1 (1 - 1)0.005
  Paraprotein1.05 (1 - 1.11)0.037