


| Journal of Hematology, ISSN 1927-1212 print, 1927-1220 online, Open Access |
| Article copyright, the authors; Journal compilation copyright, J Hematol and Elmer Press Inc |
| Journal website http://www.thejh.org |
Original Article
Volume 7, Number 4, December 2018, pages 140-148
Morphology and Chromic Status of Red Blood Cells Are Significantly Influenced by Gestational Diabetes
Ahmad Mamoun Rajaba, Saifur Rahmanb, Tawfik Mamoun Rajaba, Khawaja Husnain Haidera, c
aSulaiman AlRajhi Medical School, AlQaseem, Saudi Arabia
bMaternity and Children Hospital (MCH), Buraidah, AlQaseem, Saudi Arabia
cCorresponding Author: Khawaja Husnain Haider, Cellular and Molecular Pharmacology, Sulaiman AlRajhi Medical School, PO Box 777, Al Bukairiyah 51941, Saudi Arabia
Manuscript submitted August 6, 2018, accepted October 8, 2018
Short title: Diabetes and RBCs
doi: https://doi.org/10.14740/jh449w
| Abstract | ▴Top |
Background: The study shows the effect of hyperglycemia on RBCs in terms of morphological changes and their chromic status in women with gestational diabetes mellitus (GDM).
Methods: A total of 100 pregnant women were enrolled from Maternity and Children Hospital, Qassim, Saudi Arabia including 40 women with confirmed GDM (group-1), 30 women with either type 1 or type 2 diabetes (group-2) and 30 women with normal pregnancy without GDM or pre-gestational diabetes (control group-3). Demographic, anthropometric, medical and biochemical data were obtained from the study subjects. Complete blood count (CBC) and peripheral smears were performed from routine blood samples. Red blood cells (RBCs) morphological analysis was carried out by a hematologist and deviations in size, shape, and staining properties of the RBCs were recorded.
Results: The groups were similar in demographic characteristics (P > 0.05). RBCs showed normocytic and normochromic features in 83.3% patients of group-3 as compared to 57.5% in group-1, 30% in group-2, respectively. Microcytic hypochromic cells and anisocytosis were mostly encountered in group-2 in 53.3% and 93.3% patients respectively (P = 0.000). Forty percent of RBCs in goup-1 showed microcytic and hypochromic characteristics as compared to group-3 (P = 0.015). Additionally, 42.5% group-1 patients had anisocytosis as compared to group-3 (P = 0.003). Poikilocytosis, target cells and macrocytes were mostly observed in group-2.
Conclusions: Persistent hyperglycemia changes shape, size and hemoglobin contents of RBCs which are associated with the hyperglycemic status and exposure time.
Keywords: Chromic; Diabetes; Gestational; Erythrocytes; Hyperglycemia; Morphology; RBC
| Introduction | ▴Top |
With prevalence of diabetes mellitus (DM) expected to grow to the staggering 330 million patients worldwide by the year 2025, the Kingdom of Saudi Arabia (KSA) is listed among the countries with highest prevalence rate of approximately 23% [1-2]. Hyperglycemia complicates pregnancy either due to pre-gestational type 1 DM or type 2 DM or because of the development of gestational diabetes (GDM) during the course of pregnancy [3]. Adverse maternal and neonatal outcomes are associated with hyperglycemia and may include macrosomia, shoulder dystocia, gestational hypertension, preeclampsia, spontaneous abortion, fetal anomalies, neonatal respiratory distress syndrome, neonatal hypoglycemia, hypocalcemia, and hyperbilirubinemia which may culminate into intrauterine fetal demise [4-6]. Moreover, hyperglycemia during pregnancy increases the chance of Caesarean section and its related complications, and it even increase the risk of type 2 DM and obesity in the mother and in the offspring [7].
GDM is characterized by hyperglycemia of variable severity in pregnant women [8]. The prevalence of GDM has increased to 2-10% worldwide in all pregnancies while in KSA it has been reported during approximately 51% pregnancies [9]. These estimates are expected to rise due to increase in other maternal risk factors including obesity, older maternal age, hypertension and the familial history of diabetes [10]. Women with uncontrolled pre-gestational type 1 DM and type 2 DM may experience more serious complications, including congenital defects, due to the severe hyperglycemia from very early stages of pregnancy as compared to the patients who develop GDM only during second half of pregnancy.
As with all cells, red blood cells (RBCs) in pregnant women with uncontrolled GDM are continuously exposed to high glucose levels. Lacking in mitochondria, RBCs use glucose as their only source of energy during anaerobic glycolysis. Long-term persistent exposure to hyperglycemia causes passive glucose influx via the insulin-independent glucose transporter (GLUT1) that leads to the formation of advanced glycosylation end products (AGEs) and non-enzymatic glycosylation of membranous proteins thus decreasing their activities. These molecular events cause irreversible cross-linking of the cytoskeletal proteins and consequently disrupt RBC’s membrane elasticity and functionality, ultimately leading to shortening of their life-span [11]. Moreover, hyperglycemia negatively impacts the RBCs both structurally and functionally that may lead to various hematological disorders [12]. The structural changes in the plasma membrane compromise its membrane integrity, flexibility and deformability, and the cells become hypercoagulable and adherent. Hyperglycemia also causes membrane lipid peroxidation and osmotic fragility in human RBCs [13]. These changes lead to irreversible membranous cross-linking, inactivation of enzymes, loss of cellular elasticity and death. The stiff membranes of RBCs contribute to their high tendency to aggregate and to the blood hyperviscosity noticed in patients with diabetes, which play a pivotal role in the etiology and progression of microvascular complications [14-16]. Diabetes is also linked to altered hemoglobin levels with consequent development of anemia [17].
The present study was designed to show the effect of variant and persistent exposure of RBCs to hyperglycemia in terms of morphological changes and chromic appearance in the pregnant women with GDM and compare these changes to patients with pre-gestational diabetes, using subjects without DM or GDM as control. We hypothesized that persistent elevated blood glucose levels significantly impact RBCs’ morpho-functionality. In addition, the period of hyperglycemia might play a role in such changes. However, little is known about morphological changes of erythrocytes in vivo under hyperglycemic conditions in general and transiently during the pregnancy in particular for women with confirmed GDM.
| Patients and Methods | ▴Top |
The research was approved by Qassim Regional Research Ethics Committee, Ministry of Health, Qassim, Saudi Arabia and registered at National Committee of Bio and Medical Ethics. All the participants consented for the routine blood samples and no blood sample included in the study was taken for the experimental purpose.
A total of 100 pregnant women were enrolled from Maternity and Children Hospital (MCH), Buraidah, Qassim, Saudi Arabia from March, 2017 to January, 2018. The enrolment was done either from the obstetrics ward or outpatient department clinics. Of the total enrolments, 40% patients (n = 40) had confirmed diagnosis of GDM (group-1), 30% (n = 30) were diagnosed as having either type 1 DM or type 2 DM (group-2) and the remaining 30% (n = 30) had normal pregnancy without identified GDM or pre-gestational DM (control group-3). The GDM diagnosis was confirmed by the treating physicians’ team and was reviewed before inclusion according to the 2015 American Diabetes Association (ADA) GDM diagnostic criteria as the following one step procedure [18]. Performing oral glucose tolerance test (OGTT) in the morning after overnight fast of ≥ 8 h; 75 g OGTT with plasma glucose (PG) measurement at: fasting, 1-h and 2-h at 24 - 28 weeks in women not having pre-existing diabetes. GDM is diagnosed if PG values equals or exceed: 1) Fasting serum glucose of 92 mg/dL (5.1 mmol/L); 2) 1-h serum glucose of 180 mg/dL (10.0 mmol/L); 3) 2-h serum glucose of 153 mg/dL (8.5 mmol/L).
The diagnosis of DM in pregnancy was also done by the treating physicians’ team or by a documented pre-gestational valid medical record and reviewed according to the WHO diagnostic criteria as the following [3]. DM in pregnancy should be diagnosed by the 2006 WHO criteria for diabetes if one or more of the following criteria are met: 1) Fasting plasma glucose ≥ 7.0 mmol/L (126 mg/dL); 2) 2-h plasma glucose ≥ 11.1 mmol/L (200 mg/dL) after 75 g oral glucose load; 3) Random plasma glucose ≥ 11.1 mmol/L (200 mg/dL) in the presence of DM symptoms.
The inclusion and exclusion criteria
The Inclusion criteria in the study groups encompassed pregnant women with a gestational age of more than 24 weeks. They had proper documented diagnosis of GDM, type 1 DM or type 2 DM, and were booked cases in MCH to ensure proper follow-up measurements such as iron and folic acid supplementation and to exclude the effects of such deficiencies or other uncontrollable conditions on RBCs analysis later on.
The exclusion criteria encompassed any pregnant woman who failed to meet the above-mentioned criteria for GDM, type 1 DM or type 2 DM during her pregnancy, un-booked cases (cases which have been never followed up before coming to the hospital or had any appointment to follow the progress of their pregnancy for the health of both the mother and fetus), any condition that might affect RBCs measurements other than hyperglycemia and pregnancy i.e., known cases of hematological diseases such as any type of documented inherited or acquired anemia before pregnancy, hematological malignancies and hemolysis associated with a blood disorder or due to advanced preeclampsia and HELLP syndrome.
Data collection
After enrolment, demographic data (e.g. age, nationality, gravidity, parity, gestational weeks), anthropometric measurements (e.g. height, weight, body mass index (BMI), medical history (DM, blood pressure and other chronic diseases) and other relevant clinical data were extracted from the patients’ files. Information about biochemical parameters (e.g. fasting blood glucose (FBG), post-prandial blood sugar (PPBS) were also recorded.
Complete blood count (CBC) sent by the obstetric team as routine studies, were obtained and analysed in the MCH lab through automated hematology analyser (SYSMEX-2000). The recorded CBC parameters included RBCs count, hemoglobin (Hb), hematocrit (HCT), mean corpuscular volume (MCV) to determine size, mean corpuscular hemoglobin (MCH) to determine hypochromia and RBC distribution width (RDW).
Morphology of RBCs
The morphological studies were carried out on peripheral blood smears prepared by Leishman’s stain and analysed for qualitative and quantitative parameters relevant to size and shape of the RBCs. The RBCs morphological analysis was performed by a specialized and qualified hematologist who was blinded to the patients’ data and diagnosis. Only CBC parameters were provided for clinical relevance while interpreting the findings. The freshly stained slides were examined under microscope at 40 × and 100 × magnifications in the areas where most RBC’s were observed in monolayer and not overlapping each other. A total of 5 - 10 consecutive fields per slide were observed for any deviation in size, shape, and staining properties of the RBCs (an average of 200 RBCs observed in single microscopic field, bringing it to 1,000 - 2,000 RBCs studied in each slide) in accordance with the reference guide for grading of RBCs morphology (RBCs-M) [19]. Table 1 [19] describes our RBCs-M grading system.
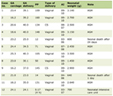 Click to view | Table 1. Reference Guide for Grading Red Blood Cell Morphology (RBC-M) /hpf (100 × oil) [19] |
Statistical analysis
All data were analysed using Statistical Package for Social Sciences (IBM SPSS, 1.0.0.903). Descriptive analysis was used for analysing the demographics and clinical parameters; their frequencies, means, and standard deviations (SD) when applicable. The data are presented as mean ± SD and the significance was assessed by their P-values using independent-samples Student’s t-test. The strength of association between the pairs of variables was measured by Pearson Chi-square test. Fisher’s exact test was used when any of the calculated variables has less than five observations. Post-hoc analysis of the results was done to calculate P-values and to relate the significance of Chi-square results with the different groups. The P < 0.05 was considered significant.
| Results | ▴Top |
All participants (n = 100) in the study were pregnant Saudi women who met our inclusion and exclusion criteria. Figure 1 illustrates the distribution of the study subjects into GDM (group-1), pre-gestational type 1 DM or type 2 DM (group-2) and control group (group-3). They received iron and folic acid which are routinely provided as supplements during pregnancy.
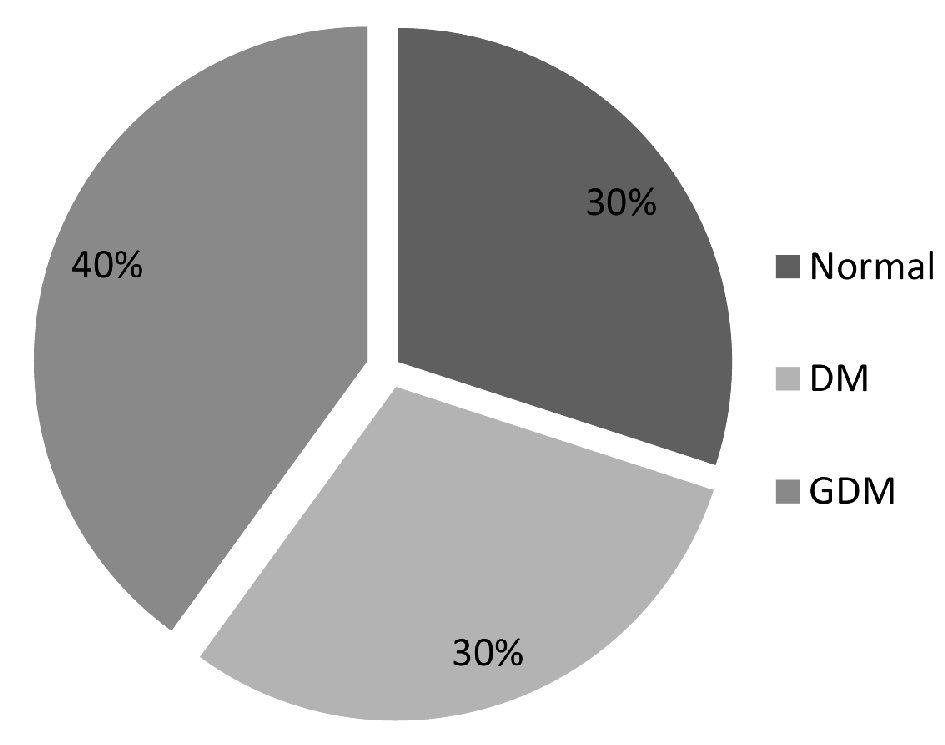 Click for large image | Figure 1. Distribution of the enrolled study subjects into the GDM, DM and control groups. |
The patients of the group-1 (n = 40) were aged between 25 - 43 years (mean age = 33.33 ± 4.8 years). They were in a mean gestational age of 34.8 ± 2.9 and a mean parity of 2.73 ± 1.8. Their mean BMI was 35.024 ± 3.1 and hence the patients were categorized as obese in accordance with 2009 guidelines of the Institute of Medicine [20]. Their FBG at the time of blood sampling ranged between 95 and 310 mg/dL (mean 148.62 ± 42.5 mg/dL) thus confirming their GDM diagnosis. Additionally, all the patients had documented normal glucose readings before pregnancy.
The patients in group-2 (n = 15 each with confirmed type 1 DM and type 2 DM) were aged 20 - 42 years (mean age = 34 ± 5.1 years). The group’s mean gestational age was 35.5 ± 2 with a mean parity of 2.17 ± 1.4. The group was also classified as obese (mean BMI = 35.02 ± 5.3) and had FBG ranging between 122 - 288 mg/dL (mean 164.99 ± 34.5). For the control group-3 (n = 30), the patients aged 20 to 42 years (mean = 32.13 ± 2.8 years). Their mean gestational age was 34.7 ± 4.6 years with mean parity of 1.47 ± 1.3 and had BMI 34.744 ± 4.4. The patients were also categorized as obese. Their FBG ranged from 63 - 90 mg/dL (mean = 76.4 ± 10.2).
The three groups of patients were similar in terms of their demographics (i.e. ethnicity, age, pregnancy, gestational age, BMI, essential supplementations), anthropometrics and blood parameters including RBCs count, hemoglobin and hematocrit (P > 0.05 between all groups; statistically insignificant difference). However, in comparison with control group-3, both GDM group-1 and type 1 DM or type 2 DM group-2 were different in FBG measurements (P = 0.001) and MCV (P = 0.034) (Table 2). Nevertheless, group-1 and group-2 were similar in FBG (P = 0.08, group-1 vs. group-2) denoting comparable hyperglycemic levels at the time of analysis during the study and offering a parallel environment for the blood morphology study. The demographic data distribution of group-1, group-2 and control group-3 are shown in Table 2 while their P-values comparing their variables’ means among the different groups using the independent-samples Student’s t-test are presented in Table 3.
Click to view | Table 2. Demographics and Laboratory Properties of the GDM, DM and Control Groups Shown as Mean ± Standard Deviation |
Click to view | Table 3. The Comparison of Variables’ Means |
Morphological and chromic analysis of RBCs
RBCs morphological analysis showed normocytic and normochromic features of RBCs in 83.3% patients (n = 25 patients) in control group-3 (P < 0.021). However, 5-15% (few; +1 degree) microcytic and hypochromic cells were observed in only 13.3% patients (n = 4) while mild anisocytosis (15-25% of the total cells) was observed in 10% patients (n = 3) and occasional macrocytes were seen in one patient (n = 3.3%). Moreover, none of the control samples exhibited poikilocytosis. On the other hand, 57.5% patients in GDM group-1 (n = 23) showed predominantly normocytic and normochromic features. However, 40% patients (n = 16) showed mild microcytic and hypochromic characteristics that accounted for three times more than the control group-3 (P = 0.015, group-1 vs. control group-3). Furthermore, 42.5% patients (n = 17) had mild anisocytosis (15-25% of the total cells) which accounted for four times higher percentage as compared to the control group-3 (P = 0.003). Additionally, poikilocytosis, target cells and macrocytes were also observed occasionally (< 1-5% in all studied microscopic fields) in 7.5% patients (n = 3), 12.5% patients (n = 5) and 10% (n = 4) respectively in GDM group-1 but their association with GDM was statistically insignificant (P = 0.125 for poikilocytosis, P = 0.55 for target cells and P = 0.383 for macrocytes vs. control group-3).
For type 1 DM or type 2 DM group-2, 53.3% patients (n = 16) had microcytic and hypochromic cells (5-15% cells throughout the microscopic fields) (P = 0.001 vs. control group). These cells were almost twice more in type 2 DM patients (73.3%; n = 11) as compared to type 1 DM patients (33.3%; n = 5). In addition, anisocytosis was observed significantly higher in all the type 1 DM and type 2 DM patients (93.3%; n = 28). This association was significantly higher in type 1 DM or type 2 DM group-2 (P = 0.000 vs. both control group-3 and GDM group-1). Occasional poikilocytosis was also observed in 40% of the patients of type 1 DM or type 2 DM group-2 (n = 12) which was significantly higher as compared to the control group-1 (P = 0.000). Nevertheless, poikilocytosis was observed three times more in type 2 DM patients (n = 9) as compared to type 1 DM (n = 3). Similarly, occasional target cells were also observed in 40% DM patients (n = 12) and the association was statistically significant as compared to the control group-3 (P = 0.000). However, the target cells were observed five times more in type 1 DM patients (n = 10) than type 2 DM (n = 2). Similarly, occasional macrocytes (< 5% in all microscopic fields) were significantly more associated with DM patients (47.6%; n = 14) as compared to the control group-3 (P = 0.000). Furthermore, the presence of macrocytes in DM samples was dramatically much higher than GDM group-1. Tables 4 and 5 summarize the counts and percentages of the different observed variables and their P-values between different groups of patients while Figure 2 shows the mean percentages of cells found to be: 1) Microcytic hypochromic; 2) Macrocytic; and 3) Anisocytic among the total of their own cell types in the groups along with comparisons of their SD and P-values. In addition, Figure 3 illustrates two microscopic images from GDM and DM cases; showing RBCs’ morphological changes.
Click to view | Table 4. The Counts and Percentages of the Different RBCs Morphological Variables Among the Studying Groups: GDM, DM and Control |
Click to view | Table 5. Chi-Square and the Resulting P-Values of the Different Observed Variables Among the Studied Groups |
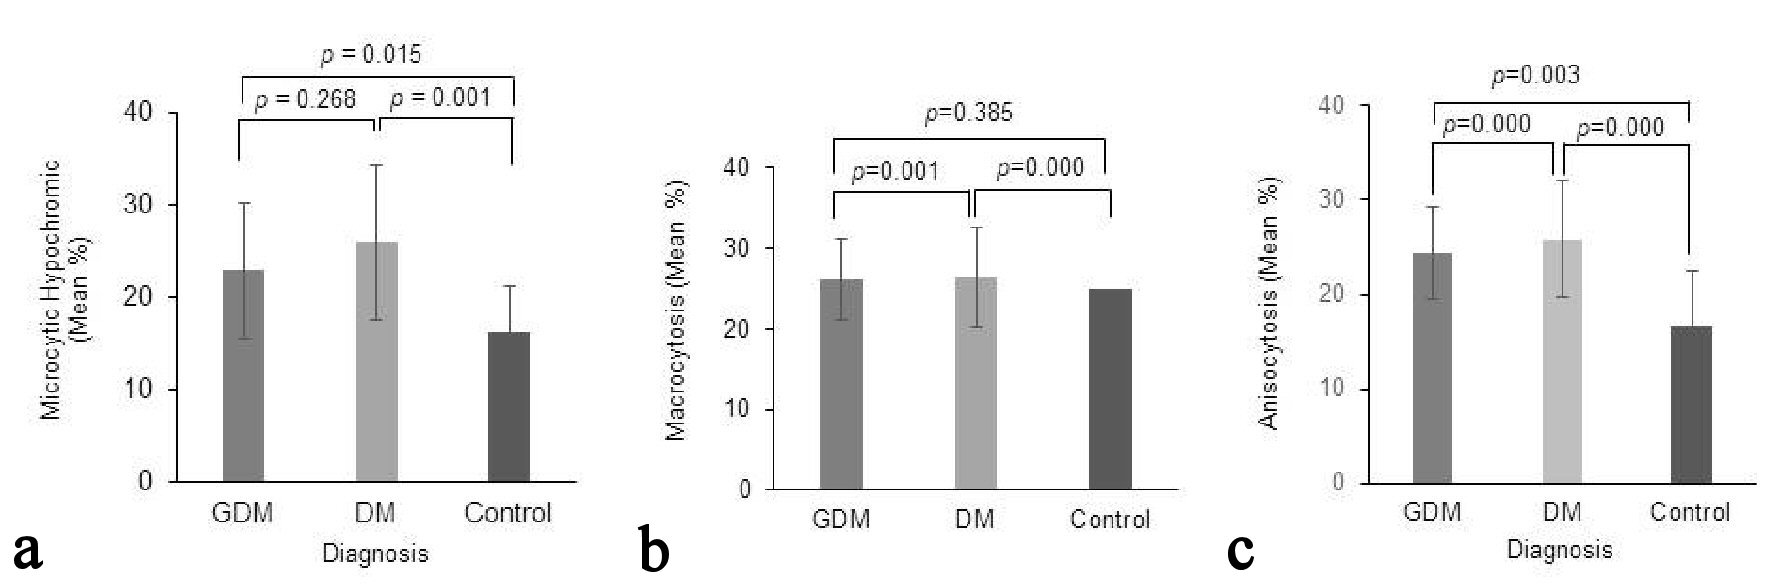 Click for large image | Figure 2. The mean percentages of cells found in different patient groups to be (a) microcytic hypochromic, (b) macrocytic and (c) anisocytic among the total of their own cell types in the groups. Comparisons of their standard deviations and P-values are illustrated. |
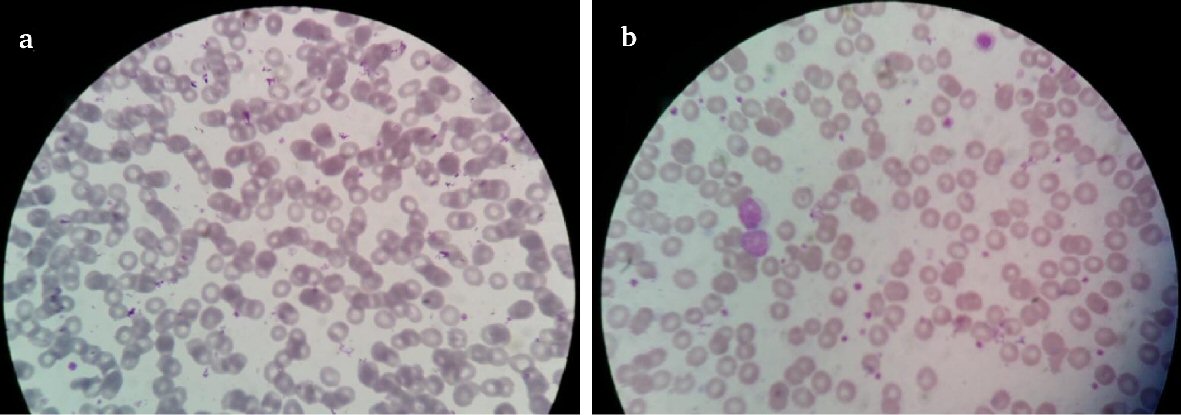 Click for large image | Figure 3. Observed microscopic pictures showing (a) anisocytosis with microcytosis and hypochromia in a GDM case, (b) anisocytosis with microcytosis, hypochromia and target cells in a DM case. |
| Discussion | ▴Top |
The patients included in the study were comparable in terms of baseline characteristics. This similarity enabled us to study the isolated effects of various degrees of hyperglycemia in the different groups of patients apart from other variables. The important findings of our study are: 1) Hyperglycemia significantly affects the morphology of RBCs; and 2) The chromic status of RBCs is significantly associated with the hyperglycemia.
Women at risk for pre-existing diabetes are tested at the first antenatal visit and GDM is usually screened at 24 - 28 weeks of gestation for proper management thereafter in accordance with the diagnosis [21]. Although GDM is a transient and reversible period of hyperglycemia, we observed that RBCs morphological changes were considerably more obvious, with stronger association in cases of overt DM. Our data showed that hyperglycemia was significantly associated with microcytosis, hypochromasia, anisocytosis, poikilocytosis, target cells and macrocytes in the patients with diabetes. The significantly higher incidence of morphological changes in erythrocytes observed in patients with pre-gestational diabetes as compared to the patients with GDM vividly reflects how the time frame of exposure to hyperglycemia may cause such shape and size alterations. These data are in harmony with the published data which showed that acuteness of morphological changes in vitro were contingent with the glucose concentration and the time duration of exposure [22]. Treatment of RBCs with different glucose concentrations in vitro causes oxidative damage to the RBCs’ membrane proteins in a time and concentration dependent manner [23]. Consequently, RBCs develop impaired flexibility and deformability which result in their slower return to the normal discoidal shape in comparison with the RBCs under normoglycemic conditions. These molecular changes have been attributed, at least partially if not fully, to the shortened lifespan of RBCs in diabetic patients due to persistent exposure to hyperglycemia [24-25]. Additionally, this process was further associated with morphological alterations manifested by a significant increase in the RBCs with serrated edges due to abnormal cell membrane (echinocytes: burr cells) in diabetic subjects [26]. Petit et al have reported that rigidity of the RBCs’ cell membrane is responsible for their decreased deformability in the diabetic patients [27].
During their lifespan under physiological conditions, RBCs experience multitude of oxidative and mechanical stressors besides ionic and osmotic alterations irked by glycemic changes in their microenvironment. The extraordinary physiological demands during pregnancy lead to plethora of variations and stressors at the metabolic and cellular levels. In this regard, RBCs show unique ability to not only survive but also contribute to the maintenance of homeostasis by an intricately regulated interaction between its plasma membrane and the cytoskeleton associated proteins [28]. Failure to do so will cause morphological changes, structural failure and cellular dysfunction thus leading to shortened lifespan of RBCs [29].
Persistent hyperglycemia also induces cell toxicity via various suggested molecular mechanisms including the overproduction of reactive oxygen species (ROS) and the associated oxidative stress, decreased ability to neutralize the effects of ROS, hyperosmolarity, irreversible glycation products (i.e. AGEs) and altered gene expression [30-32]. Besides lipid peroxidation in the membranes of fresh untreated RBCs of diabetic patients, the amount of membrane lipid peroxidation has been significantly correlated with the levels of hyperglycemia and glycosylated hemoglobin levels HbA1c [33-36]. Lipid peroxidation and altered fatty acid composition of RBCs plasma membrane cause altered relationship between membrane-bound enzymes and the cytoskeleton, induction of membrane rigidity, cellular dehydration and reduced deformability with a consequence of decreased RBCs survival [14, 37, 38]. The stiff membrane of RBCs also contributes to their high tendency to aggregate and to the blood hyperviscosity noticed in diabetic patients, which play a pivotal role in the etiology and progression of the DM-related microvascular complications [39]. These effects are much more obvious in RBCs due to their insulin-independent glucose entry that renders the cells more vulnerable to the damaging effects of hyperglycemia [39].
On the basis of mean BMI, patients in all three groups in our study were obese and their FBG values were significantly higher and widespread in the diabetic groups (groups-1 and -2 as compared to the control group-3). In line with these data, the morphological and chromic changes observed were also more pronounced in the diabetic groups (group-1 and group-2) as compared to the control group-3. Interestingly, the effect of DM in group-2 was more pronounced in terms of RBC’s morphological and chromic changes as compared with GDM group-1. This signifies the role of the time duration of exposure to hyperglycemia besides the effect of blood glucose concentrations. The authors have not come across any other studies performed to ascertain similar parameters in GDM patients.
Despite significant findings, our study is not without some limitations. The close medical follow-up for the patients included in the study allowed control of their hyperglycemia which might have curtailed the effects of hyperglycemia. Secondly, future study should include molecular data showing the molecular alterations in response to persistent exposure to hyperglycemia. Moreover, assessment of HbAC1 could have been carried out at multiple time-points during the studies.
In conclusion, variable or persistent hyperglycemia, reflected by our study groups of GDM and DM, induces various changes in the shapes, sizes and hemoglobin contents of erythrocytes that can be further anticipated by the expected alterations in the erythrocyte membrane and its cytoplasm. Additionally, our observed changes reflect the in vivo effects of hyperglycemia on RBCs which support the published data regarding prolonged exposure to hyperglycemia in terms of their deformability which decreases while their aggregation increases which interfere with the physiological flow of blood especially in the microvasculature thus contributing to diabetes complications. Therefore, we suggest that future studies should be designed to establish a relationship between erythrocyte shape changes as an early predictor of diabetic complications that may allow better management of diabetic patients.
Acknowledgments
We acknowledge the support of SRC administration for their continued support to complete this project. We are also thankful to Dr. Mamoun at MCH for his unflinching support during the project. We acknowledge the lab facilities by MCH to complete this project.
Abbreviations
AGE’s: advanced glycosylation end products; BMI: body mass index; CBC: complete blood count; DM: diabetes mellitus; FBG: fasting blood glucose; GDM: gestational diabetes mellitus; GLUT1: glucose transporter 1; RBCs: red blood cells; Hb: Hemoglobin; HCT: hematocrit; MCH: mean corpuscular hemoglobin; RDW: RBC distribution width
| References | ▴Top |
- World Health Organization. WHO Global Report on Diabetes 2016. http://www.who.int/diabetes/global-report/. Accessed December 20 2017.
- Naeem Z. Burden of diabetes mellitus in Saudi Arabia. Int J Health Sci (Qassim). 2015;9(3):V-VI.
doi - Diagnostic criteria and classification of hyperglycaemia first detected in pregnancy: a World Health Organization Guideline. Diabetes Res Clin Pract. 2014;103(3):341-363.
doi - Lindsay RS. Gestational diabetes: causes and consequences. Br J Diab Vasc Dis. 2009;9:27-31.
doi - Casey BM, Lucas MJ, McIntire DD, Leveno KJ. Pregnancy outcomes in women with gestational diabetes compared with the general obstetric population. Obstet Gynecol. 1997;90(6):869-873.
doi - Hapo Study Cooperative Research Group, Metzger BE, Lowe LP, Dyer AR, Trimble ER, Chaovarindr U, Coustan DR, et al. Hyperglycemia and adverse pregnancy outcomes. N Engl J Med. 2008;358(19):1991-2002.
doi pubmed - Dabelea D, Hanson RL, Lindsay RS, Pettitt DJ, Imperatore G, Gabir MM, Roumain J, et al. Intrauterine exposure to diabetes conveys risks for type 2 diabetes and obesity: a study of discordant sibships. Diabetes. 2000;49(12):2208-2211.
doi pubmed - World Health Organization. Definition, diagnosis and classification of diabetes mellitus and its complications. Part 1: Diagnosis and classification of diabetes mellitus. WHO/NCD/NCS/99.2 (ed). Geneva: World Health Organization; 1999.
- Alfadhli EM, Osman EN, Basri TH, Mansuri NS, Youssef MH, Assaaedi SA, Aljohani BA. Gestational diabetes among Saudi women: prevalence, risk factors and pregnancy outcomes. Ann Saudi Med. 2015;35(3):222-230.
doi pubmed - Alzzaqani AHA, Alzemily MAM, Alshahrani HSA. A status on gestational diabetes mellitus in Saudi Arabia: A systematic review. Central African J Public Health. 2016;2(2):83-88.
- Reshamwala SM, Patil ND. Biochemical changes in erythrocyte membrane in uncontrolled type 2 diabetes mellitus. Indian J Biochem Biophys. 2005;42(4):250-253.
pubmed - Yakhchalian N, Mohammadian N, Hatami K, Nosrati H, Yousofvand N. Hematological and serum biochemical analysis of streptozotocin-induced insulin dependent diabetes mellitus in male adult Wistar rats. bioRxiv. 2018.
doi - Kholoussi N, Helwa I, Amara F. Red blood cells surface morphology in diabetic ketoacidosis. Middle East J Applied Sci. 2012;2(1):51-57.
- Jain SK. Hyperglycemia can cause membrane lipid peroxidation and osmotic fragility in human red blood cells. J Biol Chem. 1989;264(35):21340-21345.
pubmed - Shin S, Ku Y, Babu N, Singh M. Erythrocyte deformability and its variation in diabetes mellitus. Indian J Exp Biol. 2007;45(1):121-128.
pubmed - Bauersachs RM, Wenby RB, Meiselman HJ. Determination of specific red blood cell aggregation indexes via an automated system. Clin Hemorheol. 1989;9(1):1-25.
- Thomas MC, MacIsaac RJ, Tsalamandris C, Power D, Jerums G. Unrecognized anemia in patients with diabetes: a cross-sectional survey. Diabetes Care. 2003;26(4):1164-1169.
doi pubmed - American Diabetes Association. Diabetes management guidelines. Diabetes Care. 2015;38(Suppl 1):S1–S93.
- Constantino BT. Reporting and grading of abnormal red blood cell morphology. Int J Lab Hematol. 2015;37(1):1-7.
doi pubmed - Institute of Medicine. Weight gain during pregnancy: re-examining the guidelines. Washington, DC: National Academies Press; 2009.
- Garrison A. Screening, diagnosis, and management of gestational diabetes mellitus. Am Fam Physician. 2015;91(7):460-467.
pubmed - Babu N, Singh M. Influence of hyperglycemia on aggregation, deformability and shape parameters of erythrocytes. Clin Hemorheol Microcirc. 2004;31(4):273-280.
pubmed - Resmi H, Akhunlar H, Temiz Artmann A, Guner G. In vitro effects of high glucose concentrations on membrane protein oxidation, G-actin and deformability of human erythrocytes. Cell Biochem Funct. 2005;23(3):163-168.
doi pubmed - McMillan DE, Utterback NG, La Puma J. Reduced erythrocyte deformability in diabetes. Diabetes. 1978;27(9):895-901.
doi pubmed - Bareford D, Jennings PE, Stone PC, Baar S, Barnett AH, Stuart J. Effects of hyperglycaemia and sorbitol accumulation on erythrocyte deformability in diabetes mellitus. J Clin Pathol. 1986;39(7):722-727.
doi pubmed - Turchetti V, Leoncini F, De Matteis C, Trabalzini L, Guerrini M, Forconi S. Evaluation of erythrocyte morphology as deformability index in patients suffering from vascular diseases, with or without diabetes mellitus: correlation with blood viscosity and intra-erythrocytic calcium. Clin Hemorheol Microcirc. 1998;18(2-3):141-149.
pubmed - Petit KL, Hunt WB, George SJ, Barnes AJ. Is impaired red cell filtration in diabetes due to small abnormal population of cells? Clin Hemorheol. 1991;16:479.
- Buys AV, Van Rooy MJ, Soma P, Van Papendorp D, Lipinski B, Pretorius E. Changes in red blood cell membrane structure in type 2 diabetes: a scanning electron and atomic force microscopy study. Cardiovasc Diabetol. 2013;12:25.
doi pubmed - Carrell RW, Winterbourn CC, Rachmilewitz EA. Activated oxygen and haemolysis. Br J Haematol. 1975;30(3):259-264.
doi pubmed - Sheetz MJ, King GL. Molecular understanding of hyperglycemia's adverse effects for diabetic complications. JAMA. 2002;288(20):2579-2588.
doi - Robertson RP, Harmon J, Tran PO, Tanaka Y, Takahashi H. Glucose toxicity in beta-cells: type 2 diabetes, good radicals gone bad, and the glutathione connection. Diabetes. 2003;52(3):581-587.
doi pubmed - Kordowiak AM, Klein A, Goc A, Dabros W. Comparison of the effect of VOSO4, Na3VO4 and NaVO3 on proliferation, viability and morphology of H35-19 rat hepatoma cell line. Pol J Pathol. 2007;58(1):51-57.
pubmed - Jain SK, McVie R, Duett J, Herbst JJ. Erythrocyte membrane lipid peroxidation and glycosylated hemoglobin in diabetes. Diabetes. 1989;38(12):1539-1543.
doi pubmed - Baynes JW, Thorpe SR. Role of oxidative stress in diabetic complications: a new perspective on an old paradigm. Diabetes. 1999;48(1):1-9.
doi - Clark IA, Cowden WB, Hunt NH. Free radical-induced pathology. Med Res Rev. 1985;5(3):297-332.
doi pubmed - Pandey KB, Rizvi SI. Markers of oxidative stress in erythrocytes and plasma during aging in humans. Oxid Med Cell Longev. 2010;3(1):2-12.
doi pubmed - Rodrigo R, Bachler JP, Araya J, Prat H, Passalacqua W. Relationship between (Na + K)-ATPase activity, lipid peroxidation and fatty acid profile in erythrocytes of hypertensive and normotensive subjects. Mol Cell Biochem. 2007;303(1-2):73-81.
doi pubmed - Jain SK, Mohandas N, Clark MR, Shohet SB. The effect of malonyldialdehyde, a product of lipid peroxidation, on the deformability, dehydration and 51Cr-survival of erythrocytes. Br J Haematol. 1983;53(2):247-255.
doi pubmed - Campos C. Chronic hyperglycemia and glucose toxicity: pathology and clinical sequelae. Postgrad Med. 2012;124(6):90-97.
doi pubmed
This article is distributed under the terms of the Creative Commons Attribution Non-Commercial 4.0 International License, which permits unrestricted non-commercial use, distribution, and reproduction in any medium, provided the original work is properly cited.
Journal of Hematology is published by Elmer Press Inc.